## Line Graphs: Effective Rank Across Layers for Different Model Scales
### Overview
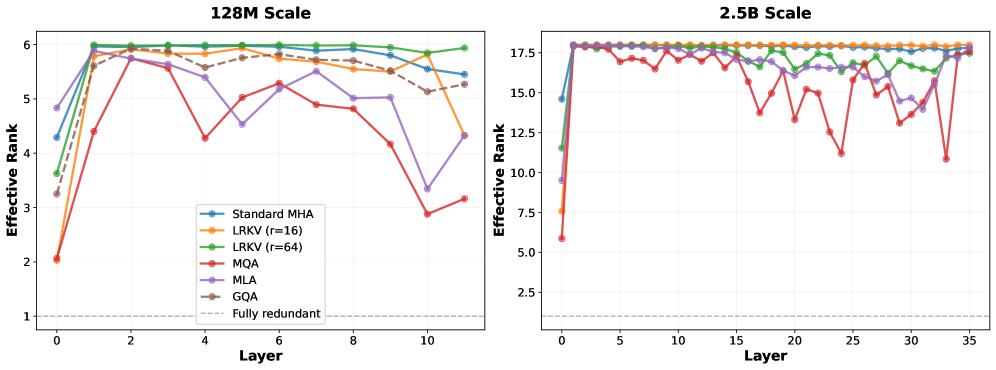
The image contains two line graphs comparing the "Effective Rank" of various neural network models across different layers. The left graph represents a 128M-scale model, while the right graph represents a 2.5B-scale model. Each graph tracks seven distinct model configurations over their respective layer ranges.
### Components/Axes
- **X-axis (Layer)**:
- 128M Scale: 0 to 10 (integer steps)
- 2.5B Scale: 0 to 35 (integer steps)
- **Y-axis (Effective Rank)**:
- 128M Scale: 1 to 6 (continuous scale)
- 2.5B Scale: 2.5 to 17.5 (continuous scale)
- **Legend**: Located in the bottom-left corner of each graph, with color-coded labels:
- Blue: Standard MHA
- Orange: LRKV (r=16)
- Green: LRKV (r=64)
- Red: MQA
- Purple: MLA
- Brown: GQA
- Dashed Gray: Fully redundant
### Detailed Analysis
#### 128M Scale Graph
- **Standard MHA (Blue)**: Starts at ~4.2 (Layer 0), declines steadily to ~3.8 (Layer 10).
- **LRKV (r=16) (Orange)**: Begins at ~2.0 (Layer 0), rises sharply to ~5.8 (Layer 2), then fluctuates between ~5.2–5.8.
- **LRKV (r=64) (Green)**: Starts at ~3.6 (Layer 0), remains flat at ~6.0 across all layers.
- **MQA (Red)**: Begins at ~2.0 (Layer 0), peaks at ~5.8 (Layer 2), then declines to ~3.0 (Layer 10).
- **MLA (Purple)**: Starts at ~4.8 (Layer 0), dips to ~3.5 (Layer 4), then rises to ~5.2 (Layer 10).
- **GQA (Brown)**: Begins at ~3.2 (Layer 0), fluctuates between ~5.0–5.8, ending at ~5.3 (Layer 10).
- **Fully Redundant (Dashed Gray)**: Constant at ~1.0 across all layers.
#### 2.5B Scale Graph
- **Standard MHA (Blue)**: Starts at ~14.8 (Layer 0), declines to ~15.2 (Layer 35).
- **LRKV (r=16) (Orange)**: Begins at ~7.6 (Layer 0), peaks at ~17.5 (Layer 1), then fluctuates between ~16.0–17.5.
- **LRKV (r=64) (Green)**: Starts at ~11.8 (Layer 0), stabilizes at ~17.5 (Layer 1), with minor fluctuations.
- **MQA (Red)**: Begins at ~5.8 (Layer 0), peaks at ~17.5 (Layer 1), then declines to ~10.0 (Layer 20), with sharp recoveries.
- **MLA (Purple)**: Starts at ~9.6 (Layer 0), peaks at ~17.5 (Layer 1), then fluctuates between ~14.0–17.5.
- **GQA (Brown)**: Begins at ~12.8 (Layer 0), stabilizes at ~17.5 (Layer 1), with minor dips.
- **Fully Redundant (Dashed Gray)**: Constant at ~1.0 across all layers.
### Key Observations
1. **Scale Correlation**: The 2.5B-scale models consistently achieve higher effective ranks (14–17.5) compared to the 128M-scale models (2–6).
2. **Layer Stability**:
- LRKV (r=64) and GQA models stabilize at maximum effective rank (~17.5) after Layer 1 in the 2.5B graph.
- MQA and MLA models in the 128M graph show significant volatility, with MQA dropping to ~3.0 by Layer 10.
3. **Baseline Consistency**: The "Fully redundant" line remains at ~1.0 in both graphs, suggesting a control baseline.
### Interpretation
The data demonstrates that larger-scale models (2.5B) achieve higher effective ranks, particularly in early layers, indicating more efficient information propagation. The 128M-scale models exhibit greater variability, with MQA and MLA underperforming in later layers. The "Fully redundant" line’s constancy implies it represents a theoretical minimum, possibly reflecting non-informative or baseline behavior. The sharp peaks in LRKV (r=16) and GQA models at Layer 1 across both scales suggest architectural optimizations for early-layer performance. The divergence between 128M and 2.5B scales highlights the impact of model size on effective rank dynamics.