## Area Chart: Successful Rebuilds Over Time
### Overview
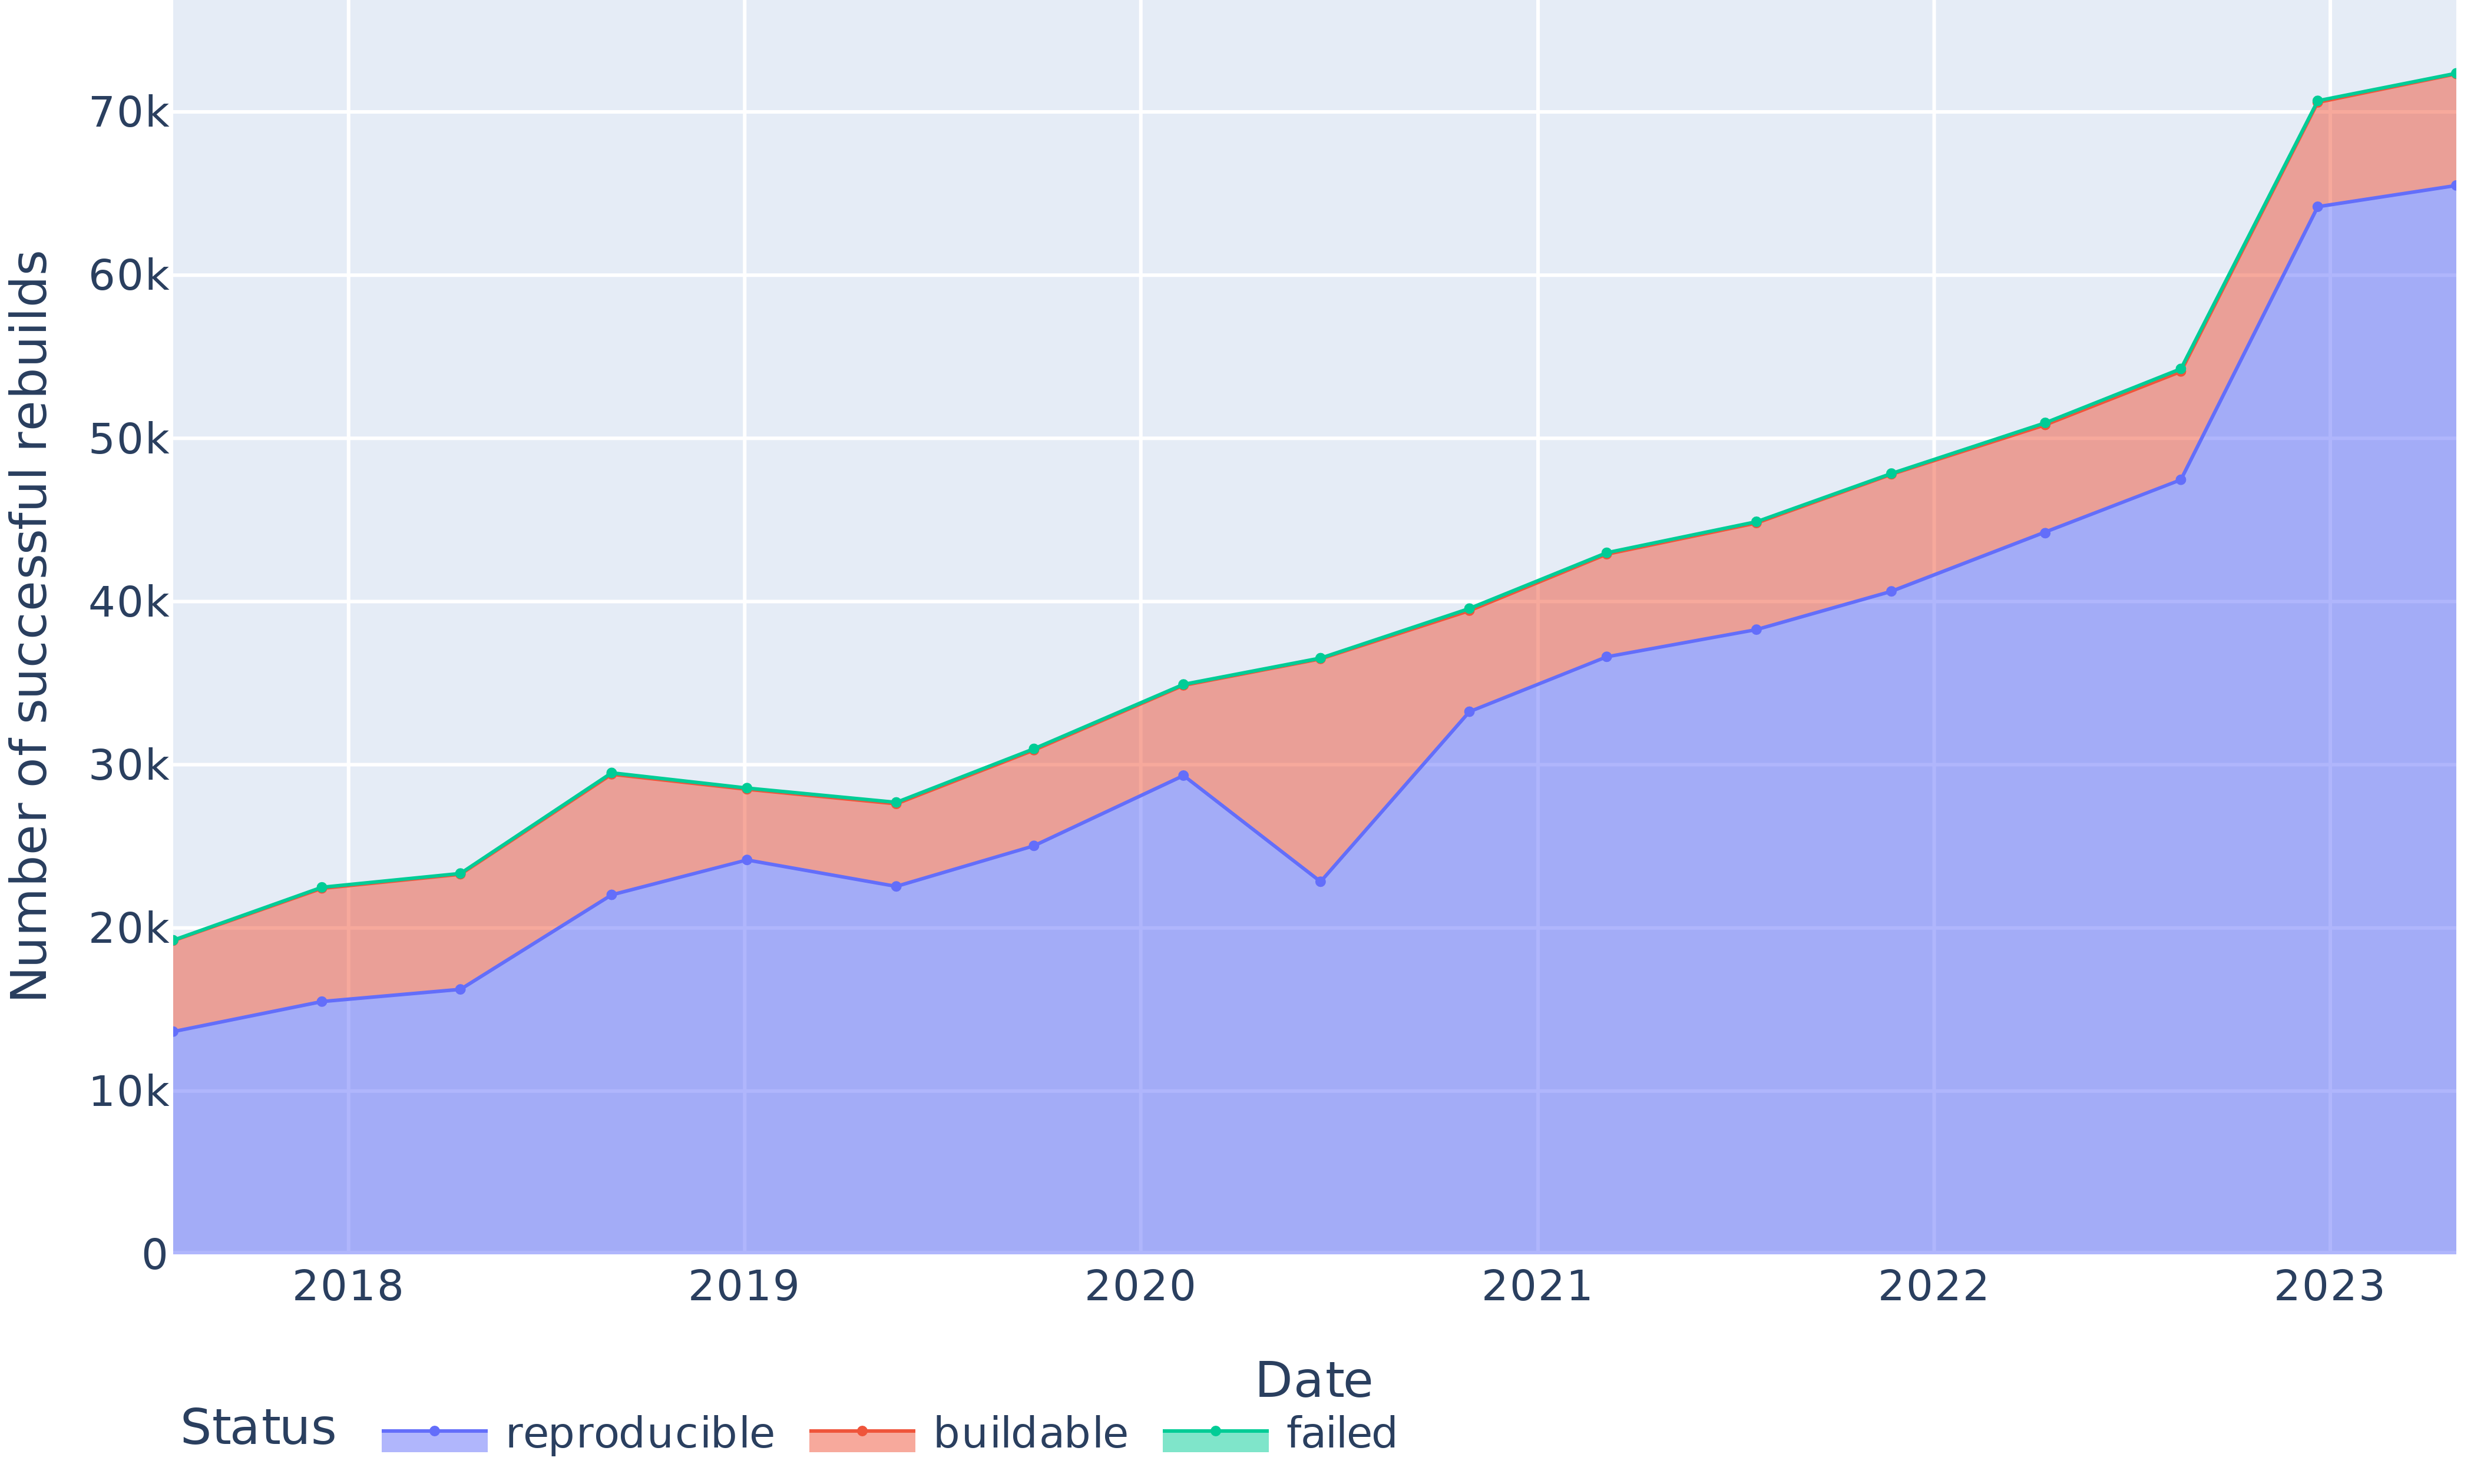
The image is an area chart displaying the number of successful rebuilds over time, categorized by status: reproducible, buildable, and failed. The x-axis represents the date from 2018 to 2023, and the y-axis represents the number of successful rebuilds, ranging from 0 to 70k.
### Components/Axes
* **Title:** Number of successful rebuilds
* **X-axis:** Date (Years: 2018, 2019, 2020, 2021, 2022, 2023)
* **Y-axis:** Number of successful rebuilds (Scale: 0, 10k, 20k, 30k, 40k, 50k, 60k, 70k)
* **Legend (Bottom-Left):**
* Reproducible (Blue)
* Buildable (Salmon/Orange)
* Failed (Green)
### Detailed Analysis
* **Reproducible (Blue):** The number of reproducible rebuilds generally increases over time.
* 2018: ~15k
* 2019: ~23k
* 2020: ~29k
* 2021: ~37k
* 2022: ~41k
* 2023: ~65k
* **Buildable (Salmon/Orange):** This represents the area between the "reproducible" line and the "failed" line.
* **Failed (Green):** The number of failed rebuilds fluctuates but generally increases slightly over time.
* 2018: ~20k
* 2019: ~29k
* 2020: ~35k
* 2021: ~43k
* 2022: ~53k
* 2023: ~72k
### Key Observations
* All three categories show an increasing trend over time, with a significant jump in "reproducible" rebuilds in 2023.
* The "reproducible" category consistently has the lowest number of rebuilds compared to "buildable" and "failed."
* The gap between "failed" and "reproducible" widens significantly in 2023.
### Interpretation
The chart indicates a general increase in the number of successful rebuilds across all categories (reproducible, buildable, and failed) from 2018 to 2023. The most significant increase is observed in the "reproducible" category in 2023, suggesting improvements or changes in the build process that led to more reproducible builds. The "failed" category consistently remains higher than the "reproducible" category, indicating that there are still areas for improvement in reducing build failures. The widening gap between "failed" and "reproducible" in 2023 could be due to a combination of factors, such as increased build attempts, changes in the build environment, or improvements in the reproducibility of successful builds.