\n
## Line Chart: Successful Rebuilds Over Time
### Overview
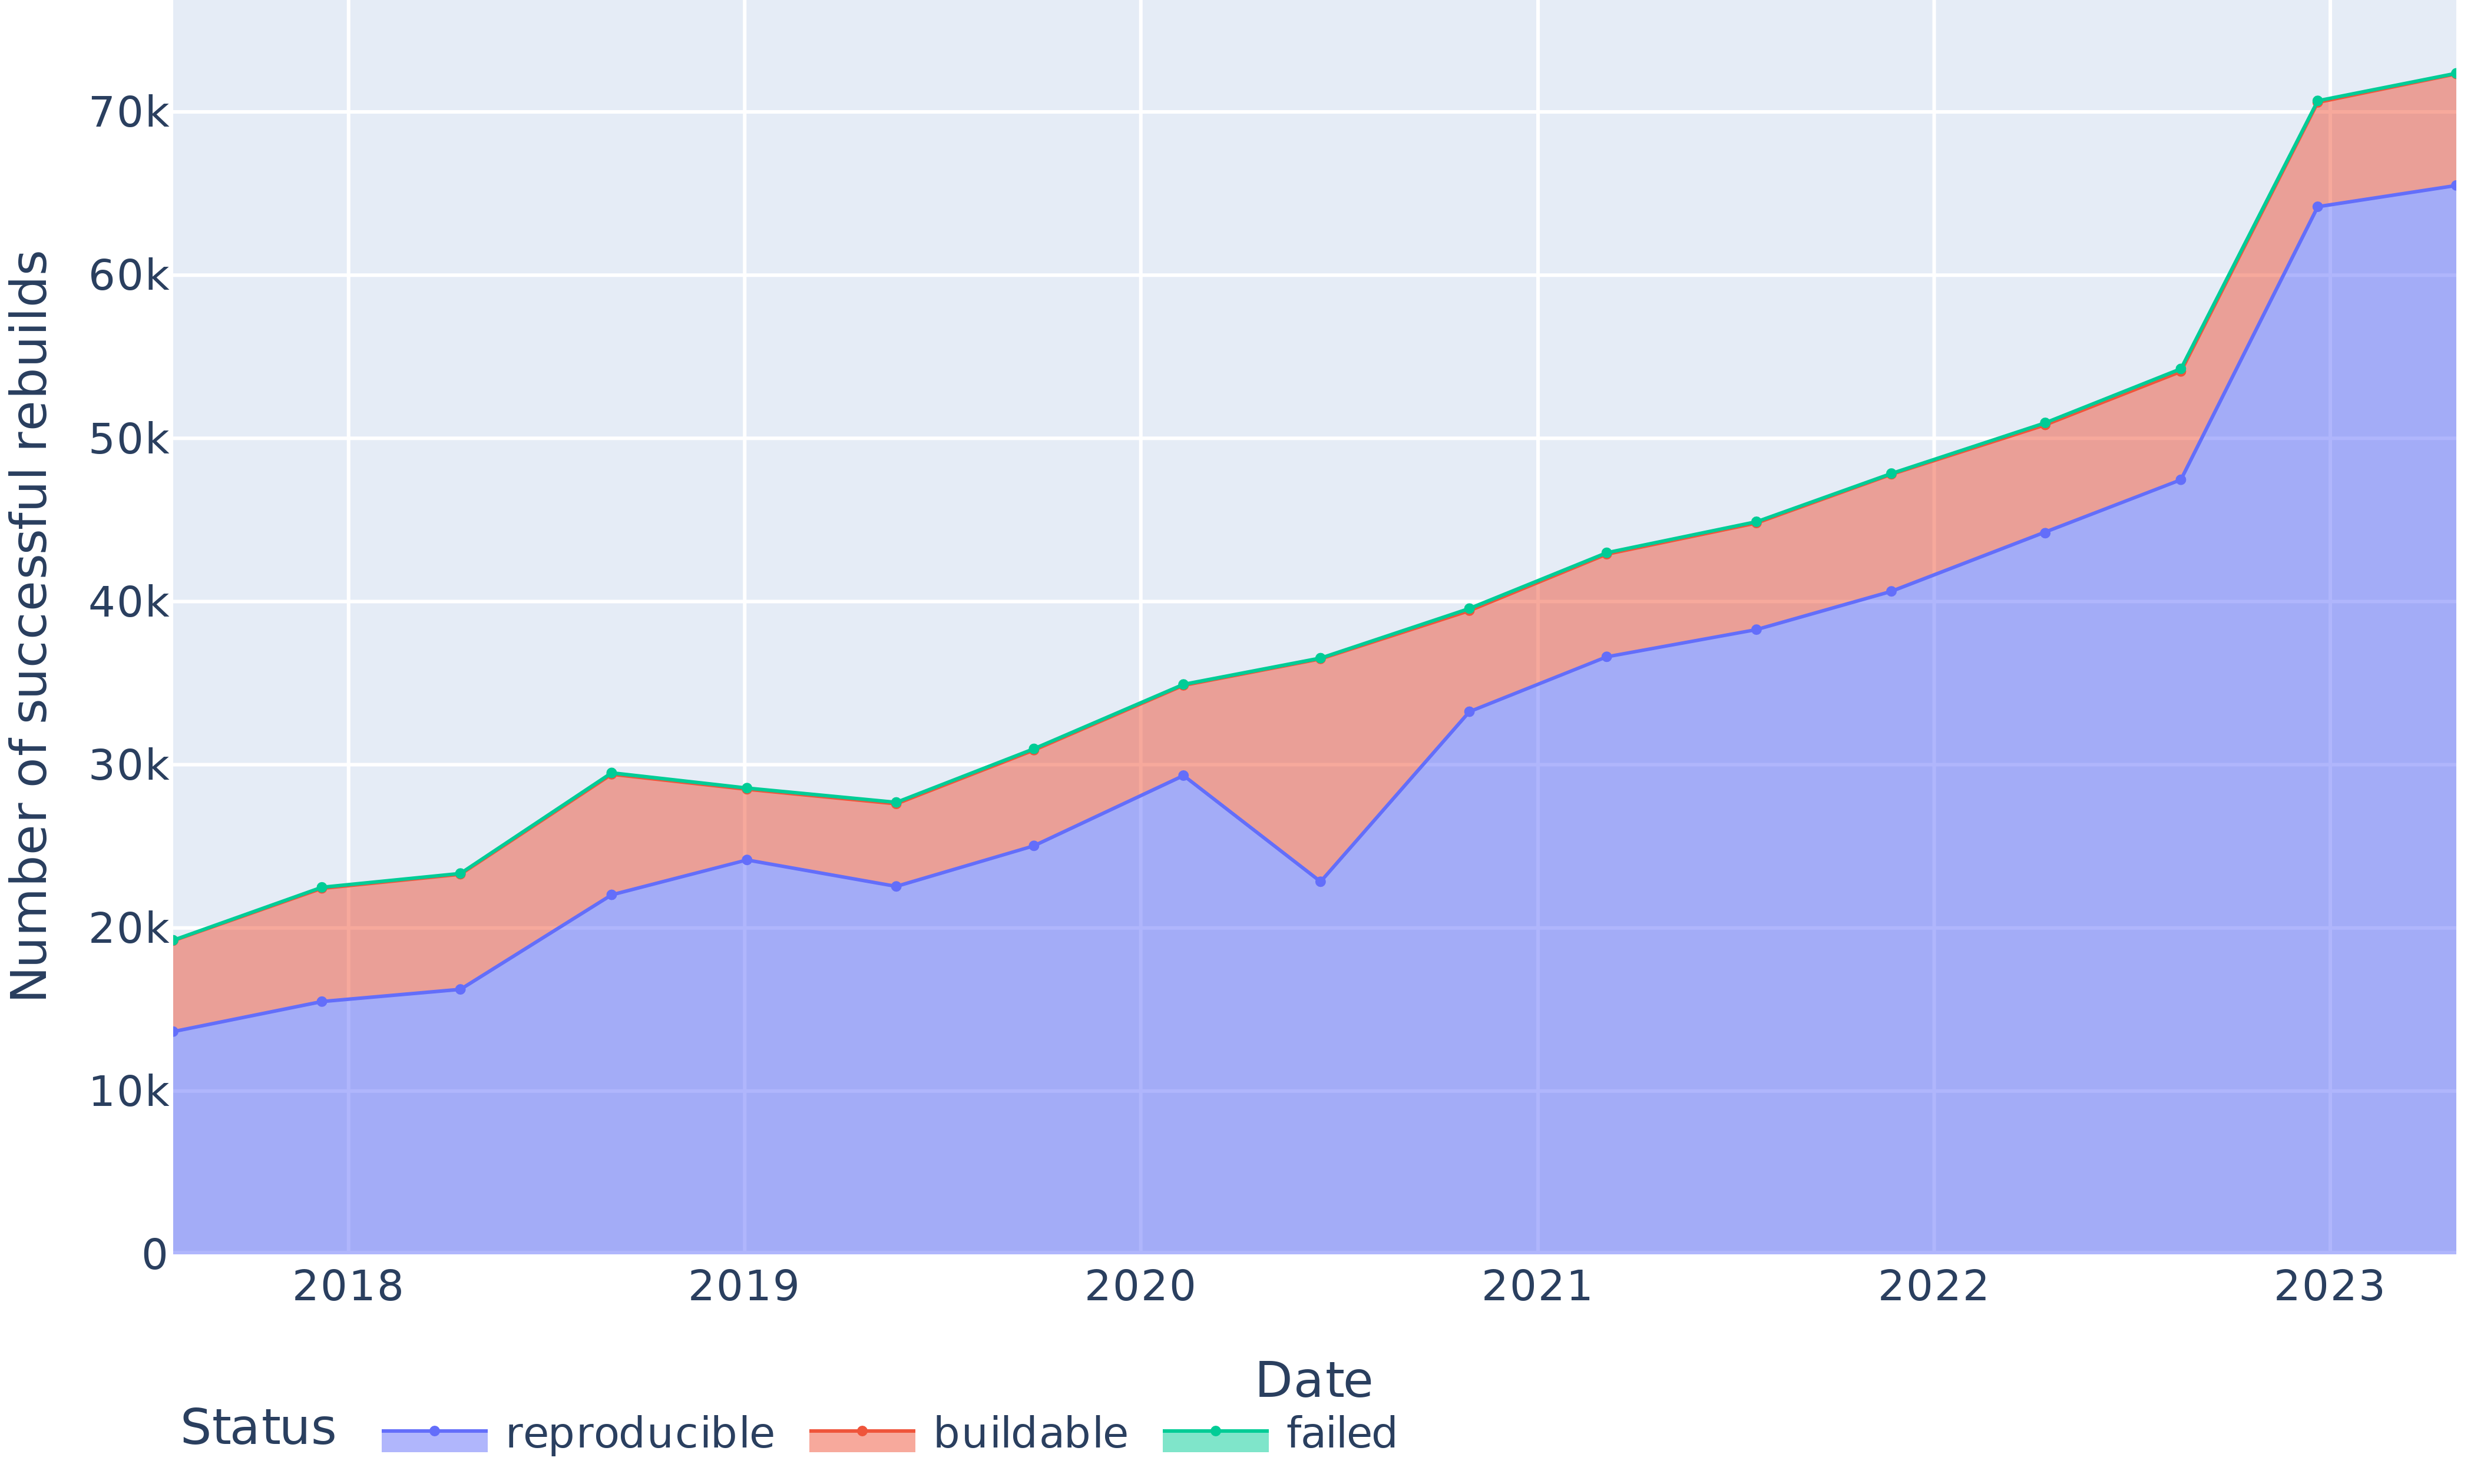
This line chart depicts the number of successful rebuilds over time, categorized by their status: reproducible, buildable, and failed. The x-axis represents the date, ranging from 2018 to 2023. The y-axis represents the number of successful rebuilds, scaled from 0 to 70,000. The chart uses three colored lines to represent each status category.
### Components/Axes
* **X-axis Title:** Date
* **Y-axis Title:** Number of successful rebuilds
* **X-axis Markers:** 2018, 2019, 2020, 2021, 2022, 2023
* **Y-axis Scale:** 0, 10k, 20k, 30k, 40k, 50k, 60k, 70k (where 'k' denotes thousands)
* **Legend:** Located at the bottom-center of the chart.
* **Reproducible:** Blue line
* **Buildable:** Red/Orange line
* **Failed:** Light Green line
### Detailed Analysis
The chart displays three distinct lines representing the number of successful rebuilds for each status over time.
* **Reproducible (Blue Line):** This line generally slopes upward from 2018 to 2023, indicating an increasing number of reproducible rebuilds.
* 2018: Approximately 16,000
* 2019: Approximately 24,000
* 2020: Approximately 28,000
* 2021: Approximately 36,000
* 2022: Approximately 44,000
* 2023: Approximately 54,000
* **Buildable (Red/Orange Line):** This line also slopes upward, but with more fluctuation than the reproducible line. It consistently remains above the reproducible line.
* 2018: Approximately 18,000
* 2019: Approximately 28,000
* 2020: Approximately 34,000
* 2021: Approximately 43,000
* 2022: Approximately 52,000
* 2023: Approximately 64,000
* **Failed (Light Green Line):** This line shows a significant increase in the number of failed rebuilds, particularly from 2022 to 2023.
* 2018: Approximately 12,000
* 2019: Approximately 18,000
* 2020: Approximately 22,000
* 2021: Approximately 30,000
* 2022: Approximately 40,000
* 2023: Approximately 58,000
### Key Observations
* All three categories show an overall increasing trend in the number of rebuilds from 2018 to 2023.
* The "Buildable" status consistently has the highest number of successful rebuilds.
* The "Failed" status shows a dramatic increase in 2023, surpassing the "Reproducible" status.
* The gap between "Buildable" and "Reproducible" rebuilds widens over time.
### Interpretation
The data suggests a growing overall activity in rebuilds. While both "Reproducible" and "Buildable" rebuilds are increasing, the substantial rise in "Failed" rebuilds in 2023 is a significant concern. This could indicate issues with the build process, increased complexity of the codebase, or changes in the testing environment. The consistent lead of "Buildable" rebuilds over "Reproducible" rebuilds suggests that while builds are generally successful, ensuring reproducibility remains a challenge. Further investigation is needed to understand the root causes of the increased failure rate in 2023 and to improve the reproducibility of builds. The increasing trend across all categories suggests a growing project or system, which may necessitate scaling infrastructure and resources.