## Line Chart: Number of Successful Rebuilds by Status (2018–2023)
### Overview
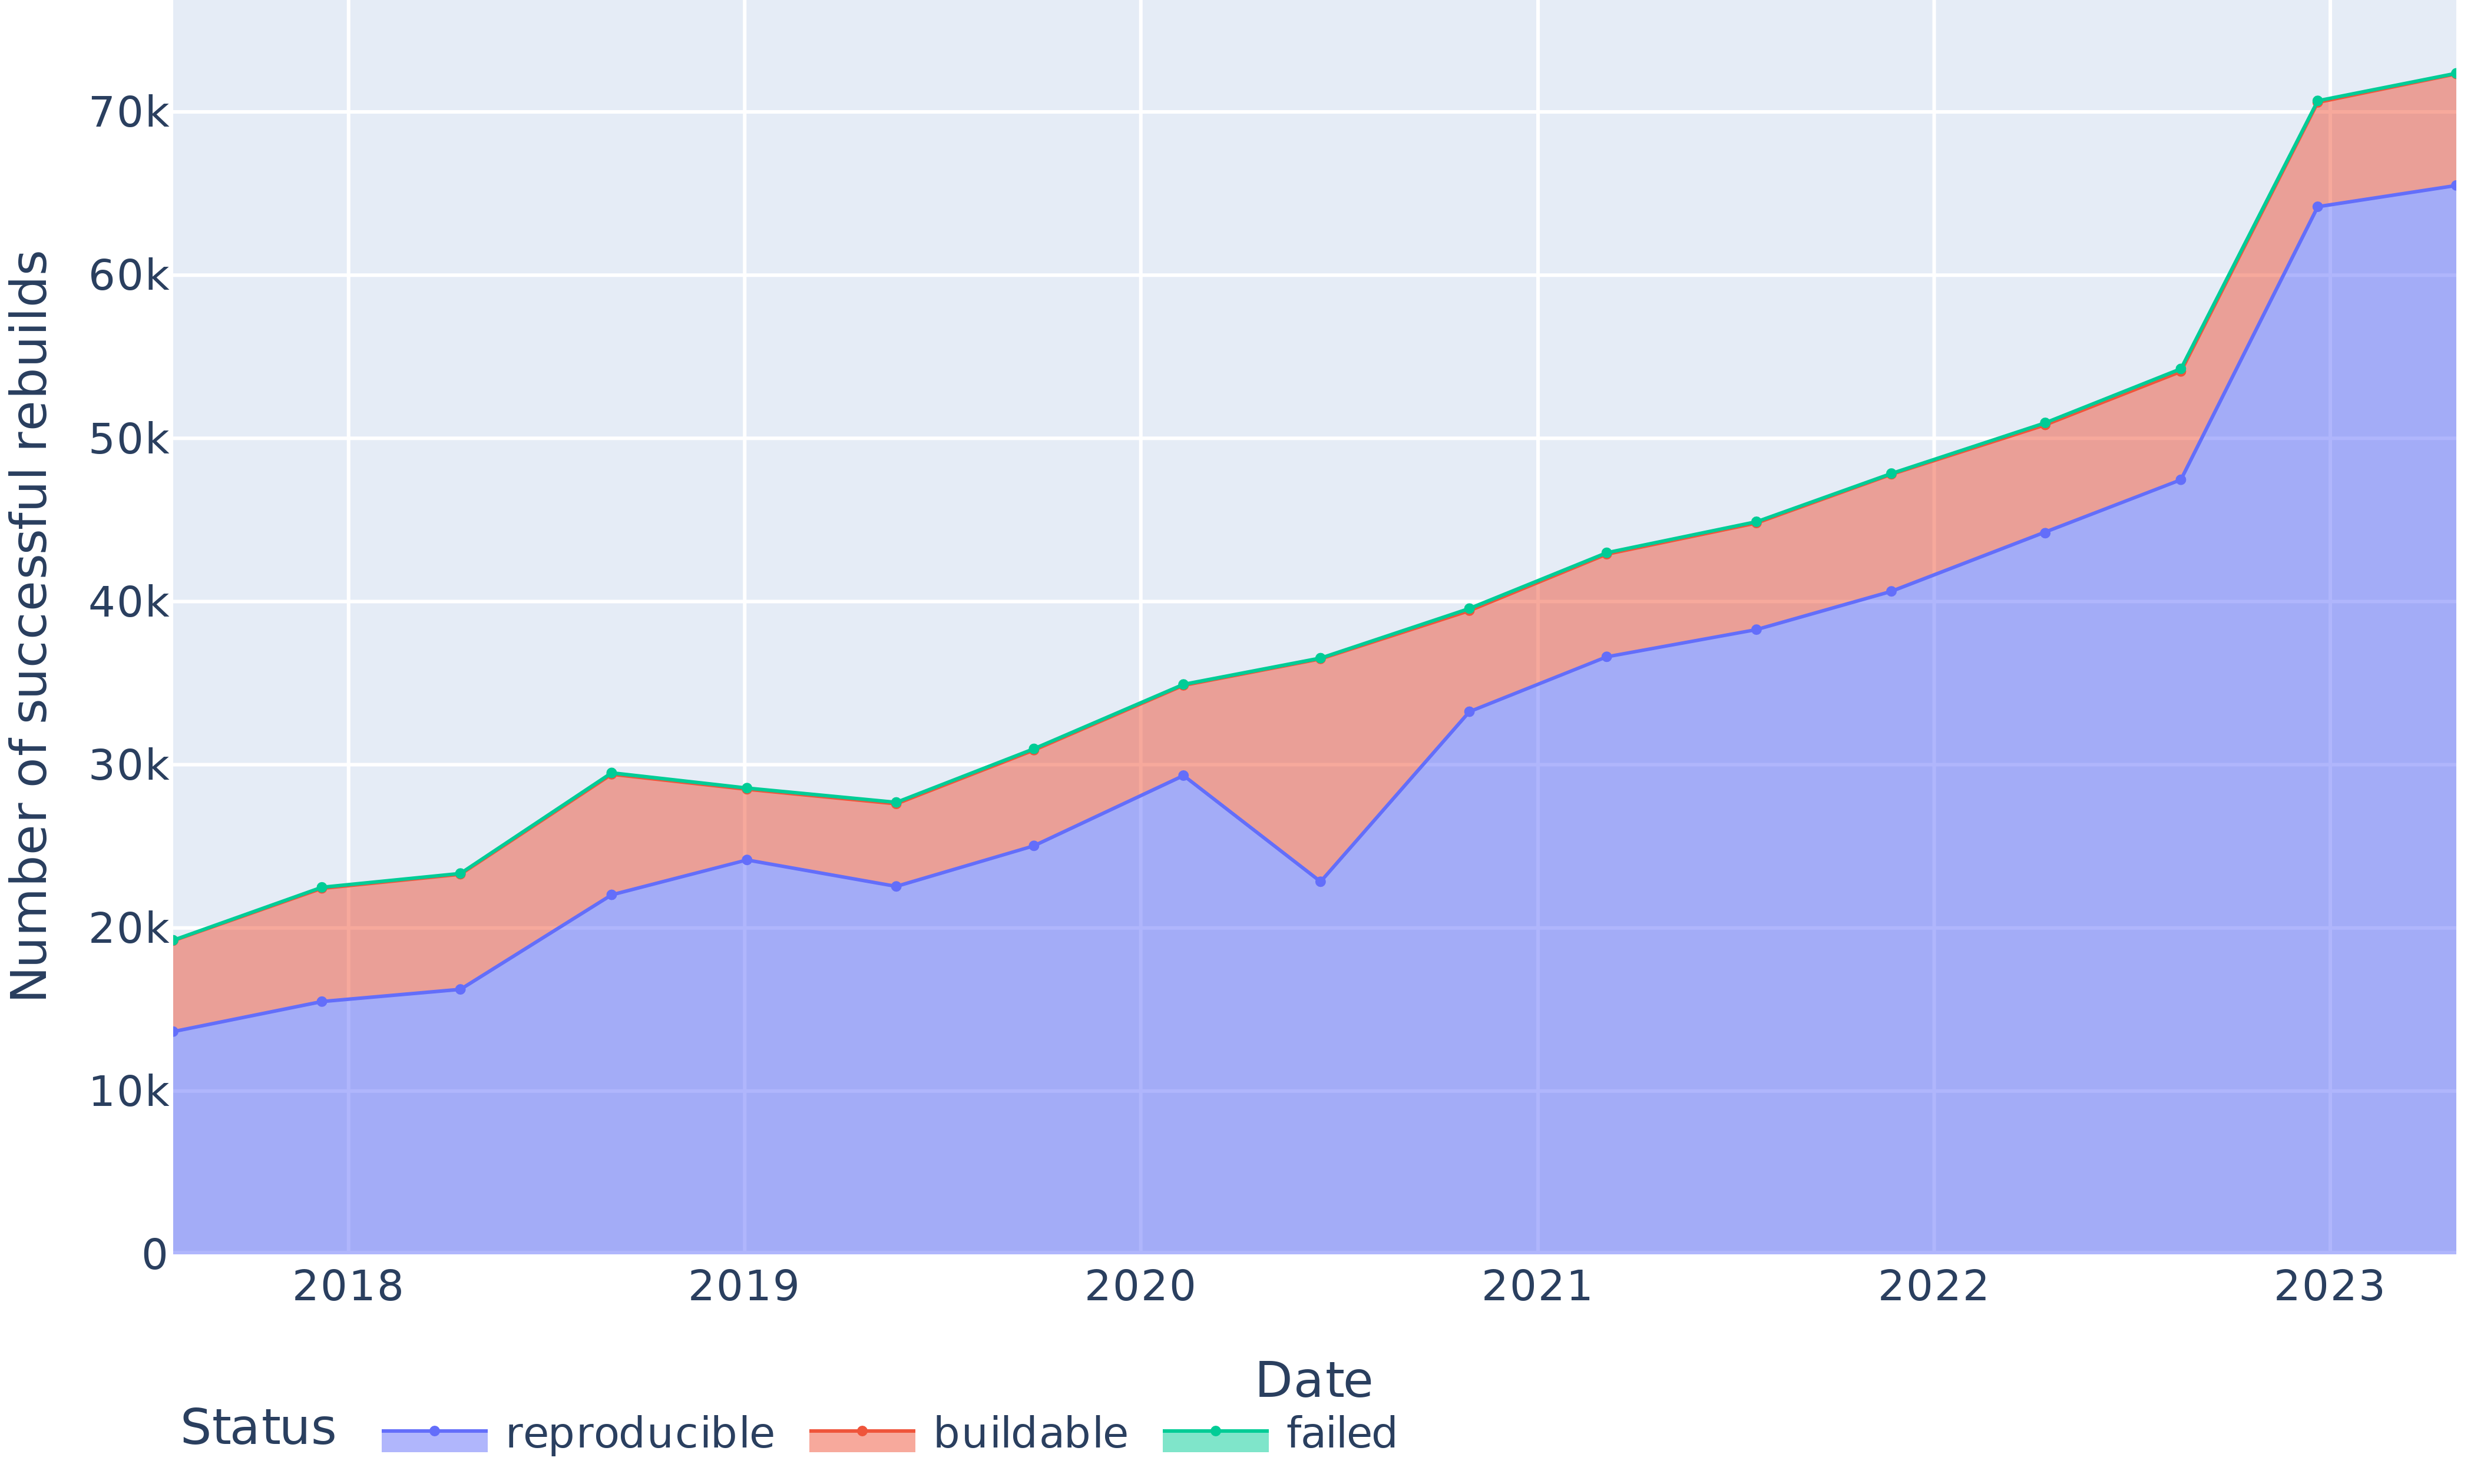
The chart visualizes the number of successful rebuilds categorized by three statuses: **reproducible** (blue), **buildable** (red), and **failed** (green) over six years. The y-axis represents the count of rebuilds, while the x-axis tracks years from 2018 to 2023. The green line (failed) consistently exceeds the red line (buildable), and the blue line (reproducible) shows the steepest growth.
### Components/Axes
- **X-axis (Date)**: Years 2018–2023, labeled at 2-year intervals.
- **Y-axis (Number of successful rebuilds)**: Scale from 0 to 70k, with increments of 10k.
- **Legend**: Located at the bottom-left, mapping colors to statuses:
- **Blue**: Reproducible
- **Red**: Buildable
- **Green**: Failed
- **Data Points**: Marked with dots matching the legend colors.
### Detailed Analysis
1. **Reproducible (Blue)**:
- **2018**: ~14k
- **2019**: ~24k
- **2020**: ~30k
- **2021**: ~35k
- **2022**: ~40k
- **2023**: ~65k
- **Trend**: Steep upward trajectory, especially post-2020.
2. **Buildable (Red)**:
- **2018**: ~6k
- **2019**: ~5k
- **2020**: ~8k
- **2021**: ~10k
- **2022**: ~12k
- **2023**: ~7k
- **Trend**: Relatively stable until 2022, then a sharp decline in 2023.
3. **Failed (Green)**:
- **2018**: ~3k
- **2019**: ~5k
- **2020**: ~10k
- **2021**: ~15k
- **2022**: ~20k
- **2023**: ~7k
- **Trend**: Gradual increase until 2022, followed by a drop in 2023.
### Key Observations
- **Reproducible rebuilds** dominate growth, surging from ~14k to ~65k (364% increase).
- **Buildable rebuilds** peak at ~12k in 2022 but collapse to ~7k in 2023, suggesting a potential anomaly or shift in criteria.
- **Failed rebuilds** rise steadily until 2022 (~20k) but drop sharply in 2023 (~7k), mirroring the buildable trend.
- The green line (failed) always exceeds the red line (buildable), indicating more rebuilds fail than are buildable.
### Interpretation
The data highlights a critical imbalance: while reproducible rebuilds grow exponentially, buildable and failed categories show conflicting trends. The 2023 drop in both buildable and failed rebuilds may reflect improved processes (fewer failures) or stricter definitions of "buildable." The dominance of reproducible rebuilds suggests a focus on reliability, but the high failure rate (green line) implies systemic issues in build processes that require investigation. The chart’s y-axis label ("successful rebuilds") conflicts with the inclusion of "failed" as a category, raising questions about data categorization or labeling accuracy.