## Diagram: Quantization and Distillation Process
### Overview
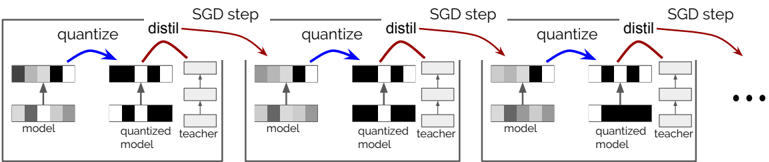
The image illustrates a cyclical process involving quantization and distillation within a machine learning context, likely related to model optimization or compression. The process is repeated over multiple Stochastic Gradient Descent (SGD) steps.
### Components/Axes
* **SGD step:** Label above each cycle, indicating a step in the Stochastic Gradient Descent optimization process.
* **Model:** Represents the current state of the model being trained or optimized.
* **Quantized Model:** Represents the model after quantization, a process of reducing the precision of the model's parameters.
* **Teacher:** Represents a pre-trained, higher-precision model used for knowledge distillation.
* **Quantize:** Label indicating the quantization operation, represented by a blue arrow.
* **Distil:** Label indicating the distillation operation, represented by a red arrow.
* **Arrows:** Indicate the flow of information or operations. Blue arrows represent quantization, and red arrows represent distillation.
### Detailed Analysis
The diagram shows a repeating sequence of operations applied over multiple SGD steps. Each step involves the following:
1. **Quantization:** The "model" is quantized, resulting in a "quantized model." This is indicated by a blue arrow labeled "quantize" pointing from the "model" to the "quantized model."
2. **Distillation:** The "quantized model" is distilled using a "teacher" model. This is indicated by a red arrow labeled "distil" pointing from the "quantized model" to the "teacher" model. The teacher model appears to be a stack of three layers.
3. **Iteration:** The process repeats for the next SGD step, with the "model" being updated based on the distillation process.
The "model" is represented by a horizontal bar divided into segments of varying shades of gray, suggesting different parameter values or weights. The "quantized model" is represented similarly, but with fewer distinct shades, indicating reduced precision. The "teacher" model is represented by a stack of three horizontal bars, each divided into segments.
The process repeats three times in the image, followed by an ellipsis ("...") indicating that the cycle continues.
### Key Observations
* The diagram highlights the cyclical nature of quantization and distillation within an SGD optimization loop.
* The use of a "teacher" model suggests a knowledge distillation approach, where a smaller, quantized model learns from a larger, more accurate model.
* The repeating "SGD step" labels indicate that this quantization and distillation process is integrated into the training or optimization process.
### Interpretation
The diagram illustrates a technique for model compression and optimization. By quantizing the model, its size and computational requirements are reduced. Knowledge distillation helps to mitigate the performance loss associated with quantization by transferring knowledge from a more accurate "teacher" model to the quantized model. This process is repeated over multiple SGD steps, allowing the model to gradually adapt to the quantized representation while maintaining accuracy. The diagram suggests an iterative approach to quantization-aware training or post-training quantization with knowledge distillation.