\n
## Diagram: Quantization and Distillation Training Loop
### Overview
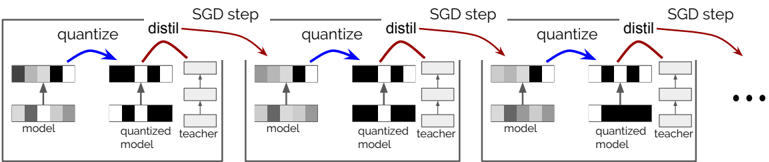
The image depicts a diagram illustrating an iterative training process involving quantization and distillation. It shows three sequential steps, each representing an "SGD step" (Stochastic Gradient Descent). Each step involves a "model", a "quantized model", and a "teacher model", with arrows indicating the flow of information between them. The diagram suggests a method for compressing a model through quantization while preserving performance via knowledge distillation.
### Components/Axes
The diagram consists of three repeating blocks, each representing a single SGD step. Within each block, there are three vertically stacked representations:
* **Model:** Represented by a series of gray and black blocks.
* **Quantized Model:** Also represented by gray and black blocks, visually similar to the "model" but intended to be a lower-precision version.
* **Teacher Model:** Represented by gray and black blocks, seemingly a higher-precision model used for guidance.
Arrows connect these components:
* **Blue Arrow (labeled "quantize"):** Points from the "model" to the "quantized model", indicating a quantization process.
* **Red Arrow (labeled "distil"):** Points from the "teacher model" to the "quantized model", indicating knowledge distillation.
* **Horizontal Arrows (labeled "SGD step"):** Connect each block to the next, representing the iterative nature of the training process.
* **Ellipsis (...):** Indicates that the process continues beyond the three shown steps.
### Detailed Analysis or Content Details
The diagram doesn't provide numerical data. It's a conceptual illustration of a process. However, we can describe the visual elements:
* **Model Representation:** Each "model" (and its quantized and teacher counterparts) is represented by a stack of approximately 6 blocks. The blocks alternate between gray and black, suggesting different levels of activation or importance. The arrangement of gray and black blocks appears consistent across the three steps, but subtle variations might exist.
* **Quantization:** The "quantize" arrow suggests that the "model" is being converted to a lower-precision representation ("quantized model"). The visual similarity between the "model" and "quantized model" suggests that the quantization process aims to preserve the overall structure of the model.
* **Distillation:** The "distil" arrow indicates that the "teacher model" is transferring knowledge to the "quantized model". This is a common technique to mitigate the performance loss that can occur during quantization.
* **SGD Step:** The iterative nature of the process is emphasized by the "SGD step" labels and the repeating blocks. This suggests that the quantization and distillation processes are integrated into a standard training loop.
### Key Observations
* The diagram highlights the interplay between model compression (quantization) and performance preservation (distillation).
* The consistent visual representation of the models across steps suggests that the quantization process is applied repeatedly during training.
* The diagram doesn't specify the details of the quantization or distillation algorithms used.
### Interpretation
The diagram illustrates a training strategy for creating a compressed model (the "quantized model") that maintains high accuracy. The process involves iteratively quantizing the model to reduce its size and computational cost, while simultaneously distilling knowledge from a larger, more accurate "teacher model" to compensate for the potential performance loss caused by quantization. This approach is commonly used in machine learning to deploy models on resource-constrained devices (e.g., mobile phones, embedded systems) without sacrificing too much accuracy. The diagram emphasizes the cyclical nature of this process, where quantization and distillation are integrated into a standard training loop driven by Stochastic Gradient Descent. The ellipsis suggests that this process is repeated multiple times to refine the quantized model. The alternating gray and black blocks within each model representation likely symbolize the activation levels or weights of the neural network, and their consistent pattern across steps suggests that the quantization process aims to preserve the essential features of the original model.