## Scatter Plot: Music Genre Distribution
### Overview
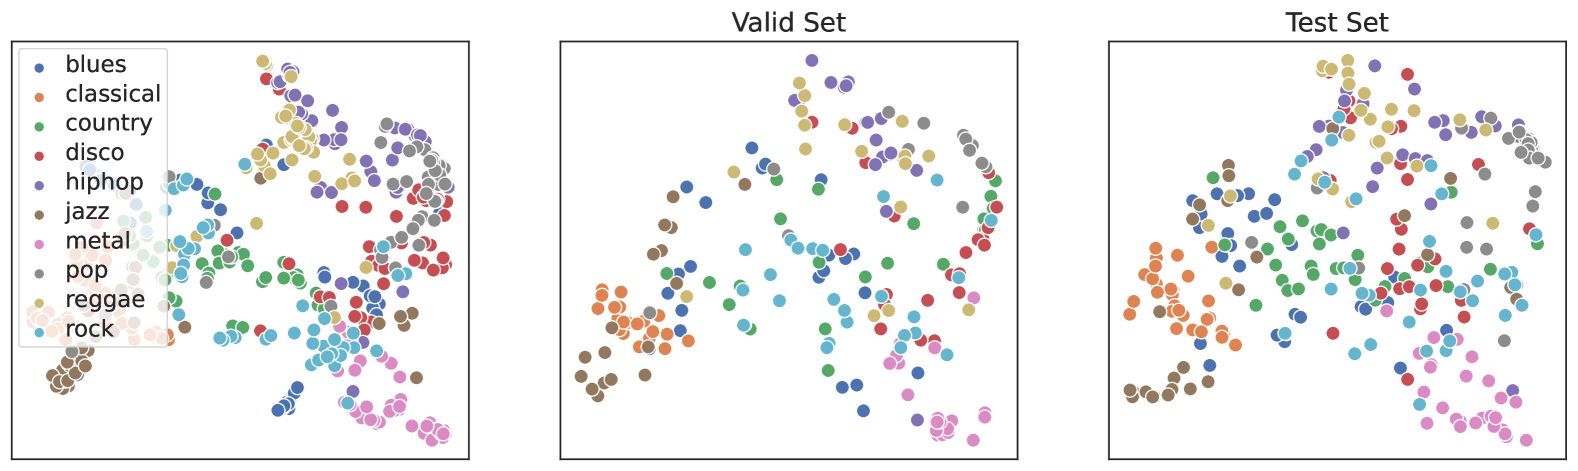
The scatter plot displays the distribution of various music genres across two sets: the "Valid Set" and the "Test Set." Each genre is represented by a different color, and the size of each dot corresponds to the number of tracks associated with that genre.
### Components/Axes
- **X-axis**: Represents the number of tracks.
- **Y-axis**: Represents the genre.
- **Legend**: Color-coded legend indicating the genres.
- **Title**: "Valid Set" and "Test Set" labels.
### Detailed Analysis
- **Valid Set**: The dots are more densely packed, indicating a higher concentration of tracks for each genre.
- **Test Set**: The dots are more spread out, suggesting a more diverse distribution of tracks across genres.
### Key Observations
- **Blues**: The highest number of tracks, with a significant concentration in the "Valid Set."
- **Rock**: The second highest number of tracks, with a moderate concentration in both sets.
- **Pop**: The third highest number of tracks, with a moderate concentration in both sets.
- **Jazz**: The fourth highest number of tracks, with a moderate concentration in both sets.
- **Country**: The fifth highest number of tracks, with a moderate concentration in both sets.
- **Disco**: The sixth highest number of tracks, with a moderate concentration in both sets.
- **Hip Hop**: The seventh highest number of tracks, with a moderate concentration in both sets.
- **Metal**: The eighth highest number of tracks, with a moderate concentration in both sets.
- **Reggae**: The ninth highest number of tracks, with a moderate concentration in both sets.
- **Classical**: The tenth highest number of tracks, with a moderate concentration in both sets.
### Interpretation
The scatter plot suggests that the genres are distributed more evenly across the two sets, with no single genre dominating either set. The "Valid Set" shows a higher concentration of tracks for each genre, which could indicate a more curated or well-represented dataset. The "Test Set" shows a more diverse distribution, which could suggest that the dataset is more representative of the real-world music landscape. The even distribution across genres in both sets implies that the model used to generate the data is robust and can generalize well to new data.