# Technical Document Extraction: Dialogue Win Rate Evolution
## 1. Document Metadata
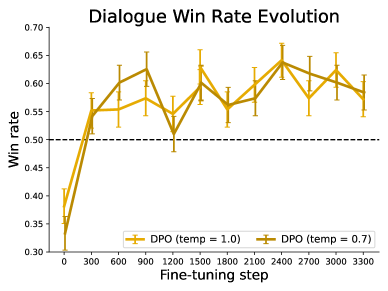
* **Title:** Dialogue Win Rate Evolution
* **Type:** Line Graph with Error Bars
* **Language:** English
## 2. Component Isolation
### Header
* **Main Title:** Dialogue Win Rate Evolution
### Main Chart Area
* **Y-Axis Label:** Win rate
* **Y-Axis Scale:** 0.30 to 0.70 (increments of 0.05)
* **X-Axis Label:** Fine-tuning step
* **X-Axis Scale:** 0 to 3300 (increments of 300)
* **Reference Line:** A horizontal dashed black line is positioned at $y = 0.50$, representing the baseline/neutral win rate.
* **Data Series:** Two lines representing Direct Preference Optimization (DPO) at different temperature settings. Both series include vertical error bars at each data point.
### Footer (Legend)
* **Location:** Bottom center, inside the chart frame.
* **Series 1:** `DPO (temp = 1.0)` — Light gold/yellow line with error bars.
* **Series 2:** `DPO (temp = 0.7)` — Dark gold/olive line with error bars.
---
## 3. Data Series Analysis and Trends
### Series 1: DPO (temp = 1.0)
* **Visual Trend:** Starts significantly below the baseline. Shows a sharp upward slope between steps 0 and 300, crossing the 0.50 threshold. It then fluctuates between 0.55 and 0.65 for the remainder of the training, peaking around step 1500 and step 2400.
* **Estimated Data Points:**
| Step | Win Rate (Approx.) |
| :--- | :--- |
| 0 | 0.38 |
| 300 | 0.55 |
| 600 | 0.55 |
| 900 | 0.57 |
| 1200 | 0.55 |
| 1500 | 0.63 |
| 1800 | 0.56 |
| 2100 | 0.60 |
| 2400 | 0.64 |
| 2700 | 0.57 |
| 3000 | 0.62 |
| 3300 | 0.57 |
### Series 2: DPO (temp = 0.7)
* **Visual Trend:** Starts lower than the temp=1.0 series. Shows a very steep upward slope initially. It generally maintains a higher win rate than the temp=1.0 series between steps 600 and 1200. It exhibits high volatility, with a notable dip at step 1200 before recovering. It converges with the other series at step 2400.
* **Estimated Data Points:**
| Step | Win Rate (Approx.) |
| :--- | :--- |
| 0 | 0.33 |
| 300 | 0.54 |
| 600 | 0.60 |
| 900 | 0.63 |
| 1200 | 0.51 |
| 1500 | 0.60 |
| 1800 | 0.56 |
| 2100 | 0.57 |
| 2400 | 0.64 |
| 2700 | 0.62 |
| 3000 | 0.60 |
| 3300 | 0.58 |
---
## 4. Key Observations and Summary
1. **Initial Learning:** Both models start with a win rate below 0.40 but rapidly improve within the first 300 fine-tuning steps to exceed the 0.50 baseline.
2. **Performance:** After step 300, both models consistently stay above the 0.50 win rate mark, indicating that fine-tuning is effective.
3. **Temperature Comparison:**
* `temp = 0.7` (darker line) shows higher peaks early on (steps 600-900) but also a more significant drop at step 1200.
* `temp = 1.0` (lighter line) appears slightly more stable in the mid-range of training.
4. **Convergence:** By the end of the observed steps (3300), both models converge to a similar win rate of approximately 0.57–0.58.
5. **Uncertainty:** The error bars are relatively consistent across all steps, typically spanning a range of ±0.03 to ±0.05 win rate points.