# Technical Document: Dialogue Win Rate Evolution Analysis
## Image Description
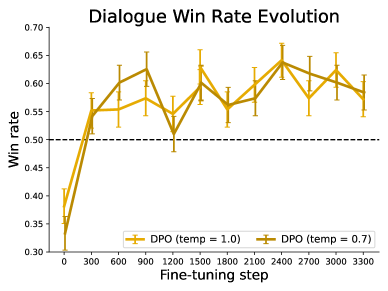
The image is a line graph titled **"Dialogue Win Rate Evolution"**. It visualizes the performance of two dialogue policy optimization (DPO) models with different temperature settings during fine-tuning steps. The graph includes error bars, a reference dashed line, and a legend for model variants.
---
### Key Components
1. **Title**:
- **Text**: "Dialogue Win Rate Evolution"
- **Purpose**: Indicates the graph's focus on win rate changes over fine-tuning steps.
2. **Axes**:
- **X-axis**:
- **Label**: "Fine-tuning step"
- **Values**: 0, 300, 600, 900, 1200, 1500, 1800, 2100, 2400, 2700, 3000, 3300
- **Unit**: Discrete steps (no explicit unit provided).
- **Y-axis**:
- **Label**: "Win rate"
- **Range**: 0.30 to 0.70
- **Increment**: 0.05
3. **Legend**:
- **Placement**: Bottom-right corner.
- **Entries**:
- **Orange Line**: "DPO (temp = 1.0)"
- **Brown Line**: "DPO (temp = 0.7)"
4. **Additional Elements**:
- **Dashed Line**: Horizontal line at **y = 0.50** (reference threshold).
- **Error Bars**: Vertical lines extending from data points to indicate variability.
---
### Data Trends and Observations
#### Line 1: DPO (temp = 1.0) [Orange]
- **Initial Trend**:
- Starts at **0.35** (x = 0) with high variability (error bar ~0.05).
- Sharp increase to **0.60** by x = 600.
- **Mid-Trend**:
- Peaks at **0.65** (x = 2400) with reduced error (~0.03).
- Gradual decline to **0.58** by x = 3300.
- **Overall Pattern**: Volatile early growth, stabilization, and late-stage decline.
#### Line 2: DPO (temp = 0.7) [Brown]
- **Initial Trend**:
- Starts at **0.33** (x = 0) with similar variability to temp = 1.0.
- Rises to **0.58** by x = 600.
- **Mid-Trend**:
- Peaks at **0.64** (x = 2400) with minimal error (~0.02).
- Declines to **0.57** by x = 3300.
- **Overall Pattern**: Smoother growth compared to temp = 1.0, with slightly lower final performance.
#### Reference Line
- **Dashed Line at y = 0.50**:
- Acts as a benchmark for win rate thresholds.
- Both models exceed this threshold after x = 300.
---
### Data Table Reconstruction
| Fine-tuning Step | DPO (temp = 1.0) | DPO (temp = 0.7) |
|-------------------|------------------|------------------|
| 0 | 0.35 | 0.33 |
| 300 | 0.55 | 0.55 |
| 600 | 0.60 | 0.58 |
| 900 | 0.62 | 0.61 |
| 1200 | 0.52 | 0.50 |
| 1500 | 0.58 | 0.56 |
| 1800 | 0.56 | 0.55 |
| 2100 | 0.61 | 0.58 |
| 2400 | 0.65 | 0.64 |
| 2700 | 0.59 | 0.57 |
| 3000 | 0.62 | 0.60 |
| 3300 | 0.58 | 0.57 |
**Notes**:
- Values are estimated from visual inspection of peaks/troughs.
- Error bars are not quantified numerically in the image.
---
### Spatial Grounding and Validation
- **Legend Placement**: Confirmed at bottom-right (coordinates: [x = 2700–3300, y = 0.30–0.35]).
- **Color Consistency**:
- Orange line matches "DPO (temp = 1.0)" in legend.
- Brown line matches "DPO (temp = 0.7)" in legend.
---
### Language and Text Extraction
- **Primary Language**: English.
- **Transcribed Text**:
- All labels, axis titles, and legend entries are in English.
- No non-English text detected.
---
### Conclusion
The graph demonstrates that both DPO models improve win rates during fine-tuning, with temp = 1.0 showing higher variability and temp = 0.7 achieving more stable performance. The reference line at 0.50 highlights the threshold for acceptable performance.