## Reasoning Process Visualization
### Overview
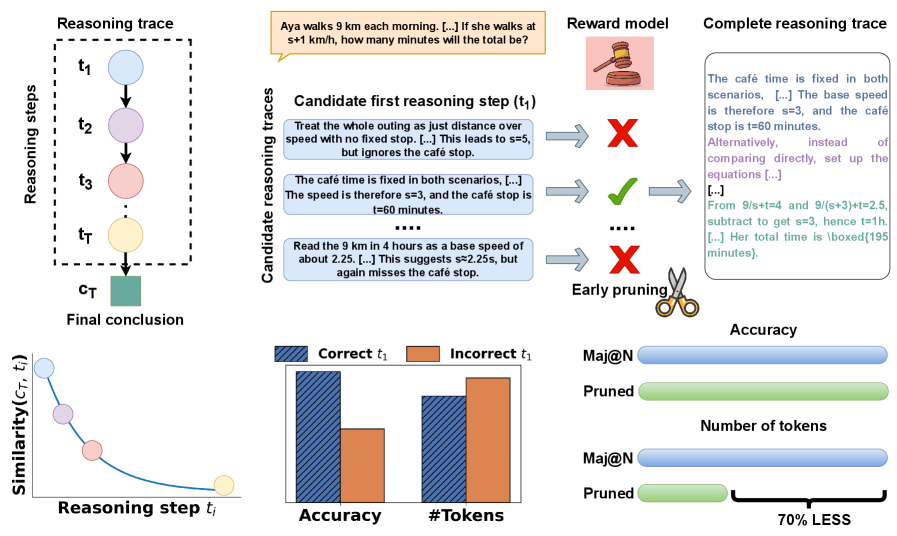
The image presents a visualization of a reasoning process, including a diagram of reasoning steps, examples of candidate reasoning traces, and bar graphs comparing the accuracy and number of tokens for correct and incorrect first reasoning steps. It also includes a comparison of "Maj@N" and "Pruned" approaches in terms of accuracy and number of tokens.
### Components/Axes
**1. Reasoning Trace Diagram (Top-Left):**
* **Title:** Reasoning trace
* **Nodes:** t1, t2, t3, tT (Reasoning steps), cT (Final conclusion)
* **Description:** A directed graph showing a sequence of reasoning steps leading to a final conclusion. The nodes are represented as circles, except for the final conclusion, which is a square.
**2. Candidate Reasoning Traces (Top-Center):**
* **Title:** Candidate reasoning traces
* **Context:** "Aya walks 9 km each morning. [...] If she walks at s+1 km/h, how many minutes will the total be?"
* **Candidate First Reasoning Step (t1):**
* "Treat the whole outing as just distance over speed with no fixed stop. [...] This leads to s=5, but ignores the café stop." (Marked with a red "X")
* "The café time is fixed in both scenarios, [...] The speed is therefore s=3, and the café stop is t=60 minutes." (Marked with a green checkmark)
* "Read the 9 km in 4 hours as a base speed of about 2.25. [...] This suggests s≈2.25s, but again misses the café stop." (Marked with a red "X")
* **Reward Model:** An image of a gavel.
* **Early Pruning:** An image of scissors.
**3. Complete Reasoning Trace (Top-Right):**
* **Title:** Complete Reasoning trace
* **Text:** "The café time is fixed in both scenarios, [...] The base speed is therefore s=3, and the café stop is t=60 minutes. Alternatively, instead of comparing directly, set up the equations [...]. [...] From 9/s+t=4 and 9/(s+3)+t=2.5, subtract to get s=3, hence t=1h. [...] Her total time is \boxed{195 minutes}."
**4. Similarity Plot (Bottom-Left):**
* **X-axis:** Reasoning step ti
* **Y-axis:** Similarity(cT, ti)
* **Description:** A plot showing the similarity between the final conclusion (cT) and each reasoning step (ti). The similarity decreases as the reasoning step gets further from the final conclusion.
**5. Bar Graphs (Bottom-Center):**
* **X-axis:** Accuracy, #Tokens
* **Y-axis:** Implicit, representing the count or percentage.
* **Legend:**
* Blue (diagonal lines): Correct t1
* Orange: Incorrect t1
* **Data:**
* Accuracy: Correct t1 bar is significantly higher than Incorrect t1 bar.
* #Tokens: Correct t1 bar is slightly higher than Incorrect t1 bar.
**6. Accuracy and Number of Tokens Comparison (Bottom-Right):**
* **Labels:** Accuracy, Number of tokens
* **Data:**
* Maj@N (Blue): Represented by a longer horizontal bar.
* Pruned (Green): Represented by a shorter horizontal bar.
* "70% LESS" indicates the Pruned approach uses significantly fewer tokens.
### Detailed Analysis
**1. Reasoning Trace Diagram:**
The diagram illustrates a sequential reasoning process. Each step (t1, t2, t3, tT) builds upon the previous one, leading to the final conclusion (cT).
**2. Candidate Reasoning Traces:**
This section provides examples of different approaches to solving a problem. The green checkmark indicates a correct first step, while the red "X" indicates incorrect steps. The problem involves calculating the total time for Aya's morning walk, considering a café stop.
**3. Complete Reasoning Trace:**
This section shows the full, correct reasoning process, including the equations and calculations needed to arrive at the final answer of 195 minutes.
**4. Similarity Plot:**
The plot shows that the earlier reasoning steps (closer to t1) have lower similarity to the final conclusion (cT) compared to the later steps (closer to tT). This suggests that the reasoning becomes more focused and aligned with the final answer as the process progresses.
**5. Bar Graphs:**
The bar graphs compare the accuracy and number of tokens for correct and incorrect first reasoning steps. The data indicates that correct first steps lead to higher overall accuracy. The number of tokens is slightly higher for correct first steps, suggesting that more detailed or precise reasoning may be required for a correct start.
**6. Accuracy and Number of Tokens Comparison:**
This section compares the "Maj@N" and "Pruned" approaches. The "Pruned" approach achieves a comparable accuracy with significantly fewer tokens (70% less), indicating a more efficient reasoning process.
### Key Observations
* Correct initial reasoning steps (t1) are crucial for achieving higher accuracy.
* The similarity between reasoning steps and the final conclusion increases as the reasoning process progresses.
* The "Pruned" approach offers a more efficient reasoning process by using significantly fewer tokens while maintaining comparable accuracy.
### Interpretation
The image demonstrates the importance of accurate initial reasoning steps in problem-solving. The candidate reasoning traces highlight different approaches, with the correct approach leading to a successful solution. The similarity plot visualizes how the reasoning process converges towards the final conclusion. The bar graphs and the "Maj@N" vs. "Pruned" comparison emphasize the trade-off between accuracy and efficiency in reasoning, suggesting that pruning techniques can significantly reduce the computational cost without sacrificing accuracy. The "Pruned" approach is more efficient, suggesting that it is a better method for reasoning.