\n
## Diagram: Reasoning Trace & Reward Model
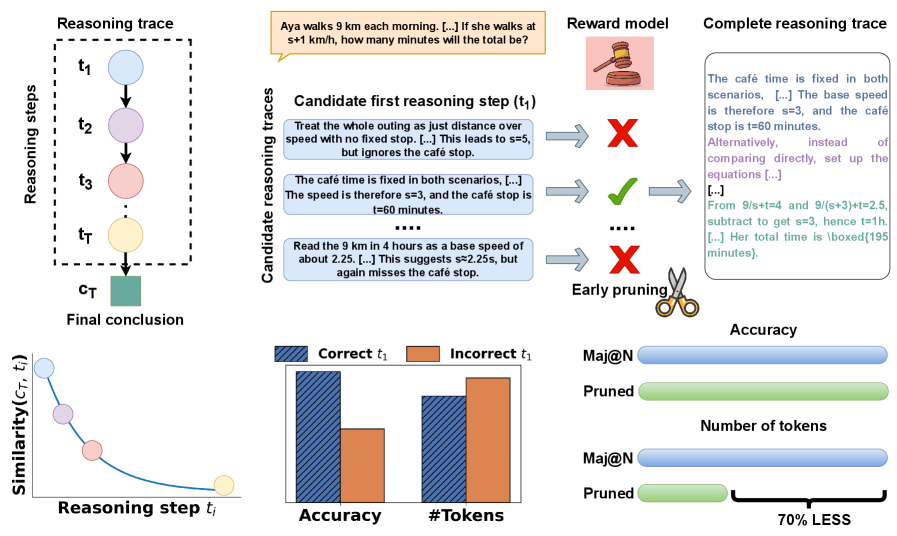
### Overview
The image depicts a diagram illustrating a reasoning trace process, likely within a large language model (LLM) context. It shows how candidate reasoning steps are evaluated by a reward model, pruned, and ultimately lead to a final conclusion. The diagram also includes a visualization of similarity between the final conclusion and intermediate reasoning steps, alongside a comparison of accuracy and token usage with and without pruning.
### Components/Axes
The diagram is segmented into several key areas:
* **Reasoning Trace (Left):** A flow diagram showing reasoning steps (t1 to tT) leading to a final conclusion (CT).
* **Candidate Reasoning Traces & Reward Model (Center):** Illustrates candidate reasoning steps being evaluated by a reward model (represented by a chef icon). Arrows indicate acceptance (green checkmark) or rejection (red X) of steps.
* **Similarity Graph (Bottom-Left):** A line graph plotting "Similarity (CT, t_i)" against "Reasoning step t_i".
* **Accuracy vs. #Tokens (Bottom-Center):** Two bar charts comparing "Accuracy" and "#Tokens" for "Correct t1" and "Incorrect t1", as well as "Mai@N" and "Pruned" scenarios.
* **Mai@N vs Pruned (Bottom-Right):** A visual comparison showing a reduction in token usage ("70% LESS") when using "Pruned" reasoning traces.
The axes for the similarity graph are:
* X-axis: Reasoning step t_i
* Y-axis: Similarity (CT, t_i)
The axes for the bar charts are:
* X-axis: Correct t1, Incorrect t1, Mai@N, Pruned
* Y-axis: Accuracy, #Tokens
### Detailed Analysis or Content Details
**Reasoning Trace:**
The reasoning trace shows a series of steps (t1, t2, t3… tT) represented as circles connected by arrows, culminating in a final conclusion (CT) represented as a rectangular block.
**Candidate Reasoning Traces & Reward Model:**
Three candidate reasoning steps (t1) are presented:
1. "Treat the whole outing as just distance over speed with no fixed stop. […] This leads to s=5, but ignores the café stop." (Rejected - Red X)
2. "The café time is fixed in both scenarios. […] The speed is therefore s=3, and the café stop is t=60 minutes." (Accepted - Green Checkmark)
3. "Read the 9 km in 4 hours as a base speed of about 2.25. […] This suggests s=2.25, but again misses the café stop." (Rejected - Red X)
The complete reasoning trace (rightmost column) provides the final solution: "The café time is fixed in both scenarios. […] The base speed is therefore s=3, and the café stop is t=60 minutes. Alternatively, instead of comparing directly, set up the equations […] […] From 9/s+t=4 and 9/(s+3)+t=2.5, subtract to get s=3, hence t=1h. […] Her total time is boxed(195 minutes)."
**Similarity Graph:**
The similarity graph shows a decreasing trend. The line starts at approximately 1.0 (high similarity) at t1 and slopes downward, reaching approximately 0.2-0.3 at tT.
**Accuracy vs. #Tokens Bar Charts:**
* **Accuracy:** "Correct t1" has a significantly higher accuracy (approximately 0.9) than "Incorrect t1" (approximately 0.3). "Mai@N" has an accuracy of approximately 0.8, while "Pruned" has an accuracy of approximately 0.7.
* **#Tokens:** "Correct t1" uses approximately 50 tokens, "Incorrect t1" uses approximately 40 tokens. "Mai@N" uses approximately 60 tokens, while "Pruned" uses approximately 20 tokens.
**Mai@N vs Pruned:**
The diagram highlights that pruning reduces the number of tokens by "70% LESS".
### Key Observations
* The reward model effectively filters out incorrect reasoning steps.
* Similarity between intermediate reasoning steps and the final conclusion decreases as the reasoning process progresses.
* Pruning significantly reduces token usage with a slight decrease in accuracy.
* Correct reasoning steps lead to higher accuracy.
### Interpretation
This diagram illustrates a method for improving the efficiency and accuracy of reasoning processes in LLMs. The reward model acts as a gatekeeper, eliminating unproductive reasoning paths early on ("Early pruning"). This pruning process reduces computational cost (measured in tokens) without significantly sacrificing accuracy. The similarity graph suggests that initial reasoning steps are more closely aligned with the final conclusion, and subsequent steps diverge as the model refines its understanding. The comparison between "Mai@N" and "Pruned" demonstrates the trade-off between accuracy and efficiency, suggesting that pruning can be a valuable technique for optimizing LLM performance. The example problem (Aya walks 9 km each morning…) provides a concrete context for understanding the reasoning process. The use of visual metaphors (chef for reward model, scissors for pruning) enhances the clarity of the diagram.