## Chart: Pass@k vs. Number of Samples
### Overview
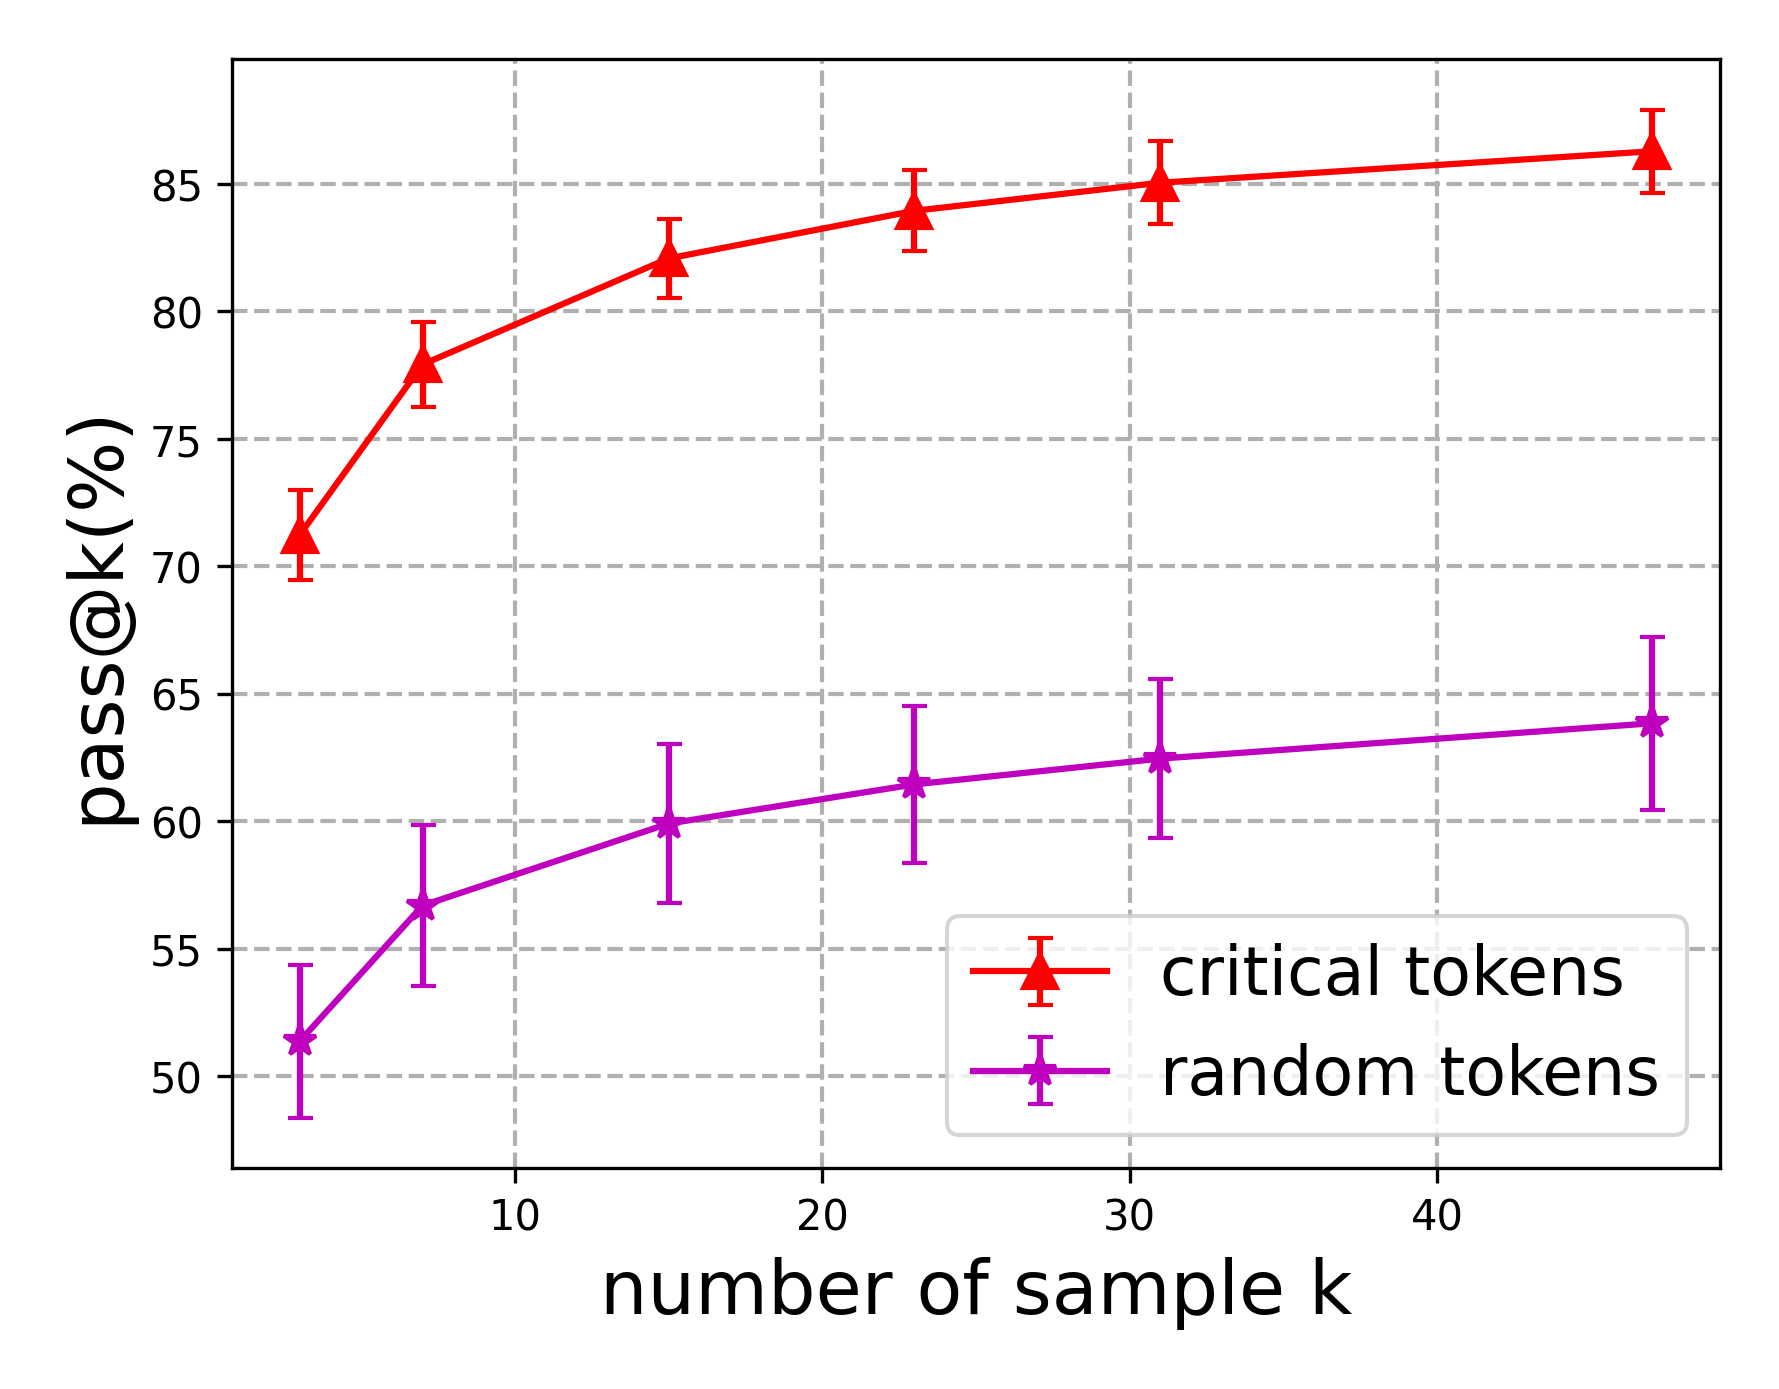
The image is a line chart comparing the "pass@k(%)" metric for "critical tokens" and "random tokens" against the "number of sample k". The chart displays two lines, one red for "critical tokens" and one purple for "random tokens", with error bars indicating variability. The x-axis represents the number of samples, and the y-axis represents the pass@k percentage.
### Components/Axes
* **X-axis:** "number of sample k" with tick marks at 10, 20, 30, and 40.
* **Y-axis:** "pass@k(%)" with tick marks at 50, 55, 60, 65, 70, 75, 80, and 85.
* **Legend:** Located in the bottom-right corner, it identifies the red line as "critical tokens" and the purple line as "random tokens".
* **Gridlines:** Gray dashed lines are present for both x and y axes.
### Detailed Analysis
* **Critical Tokens (Red):** The red line represents the "pass@k(%)" for "critical tokens". The trend is generally upward, with a steeper increase initially, followed by a plateau.
* At k=5, pass@k(%) ≈ 71% ± 2%
* At k=15, pass@k(%) ≈ 82% ± 2%
* At k=30, pass@k(%) ≈ 85% ± 1%
* At k=45, pass@k(%) ≈ 86% ± 1%
* **Random Tokens (Purple):** The purple line represents the "pass@k(%)" for "random tokens". The trend is also upward, but less steep than the "critical tokens" line.
* At k=5, pass@k(%) ≈ 51% ± 3%
* At k=15, pass@k(%) ≈ 60% ± 3%
* At k=30, pass@k(%) ≈ 62% ± 3%
* At k=45, pass@k(%) ≈ 64% ± 3%
### Key Observations
* The "pass@k(%)" is consistently higher for "critical tokens" compared to "random tokens" across all values of k.
* The "pass@k(%)" for "critical tokens" increases rapidly initially, then plateaus.
* The "pass@k(%)" for "random tokens" increases more gradually.
* The error bars suggest more variability in the "random tokens" data, especially at lower values of k.
### Interpretation
The data suggests that using "critical tokens" leads to a significantly higher "pass@k(%)" compared to using "random tokens". This indicates that "critical tokens" are more effective in achieving the desired outcome, as measured by the "pass@k(%)" metric. The initial rapid increase in "pass@k(%)" for "critical tokens" suggests that a relatively small number of samples is sufficient to achieve a substantial improvement, while further increasing the number of samples provides diminishing returns. The higher variability in the "random tokens" data may indicate that the performance is more sensitive to the specific set of random tokens used.