## Line Chart: pass@k(%) vs. number of sample k
### Overview
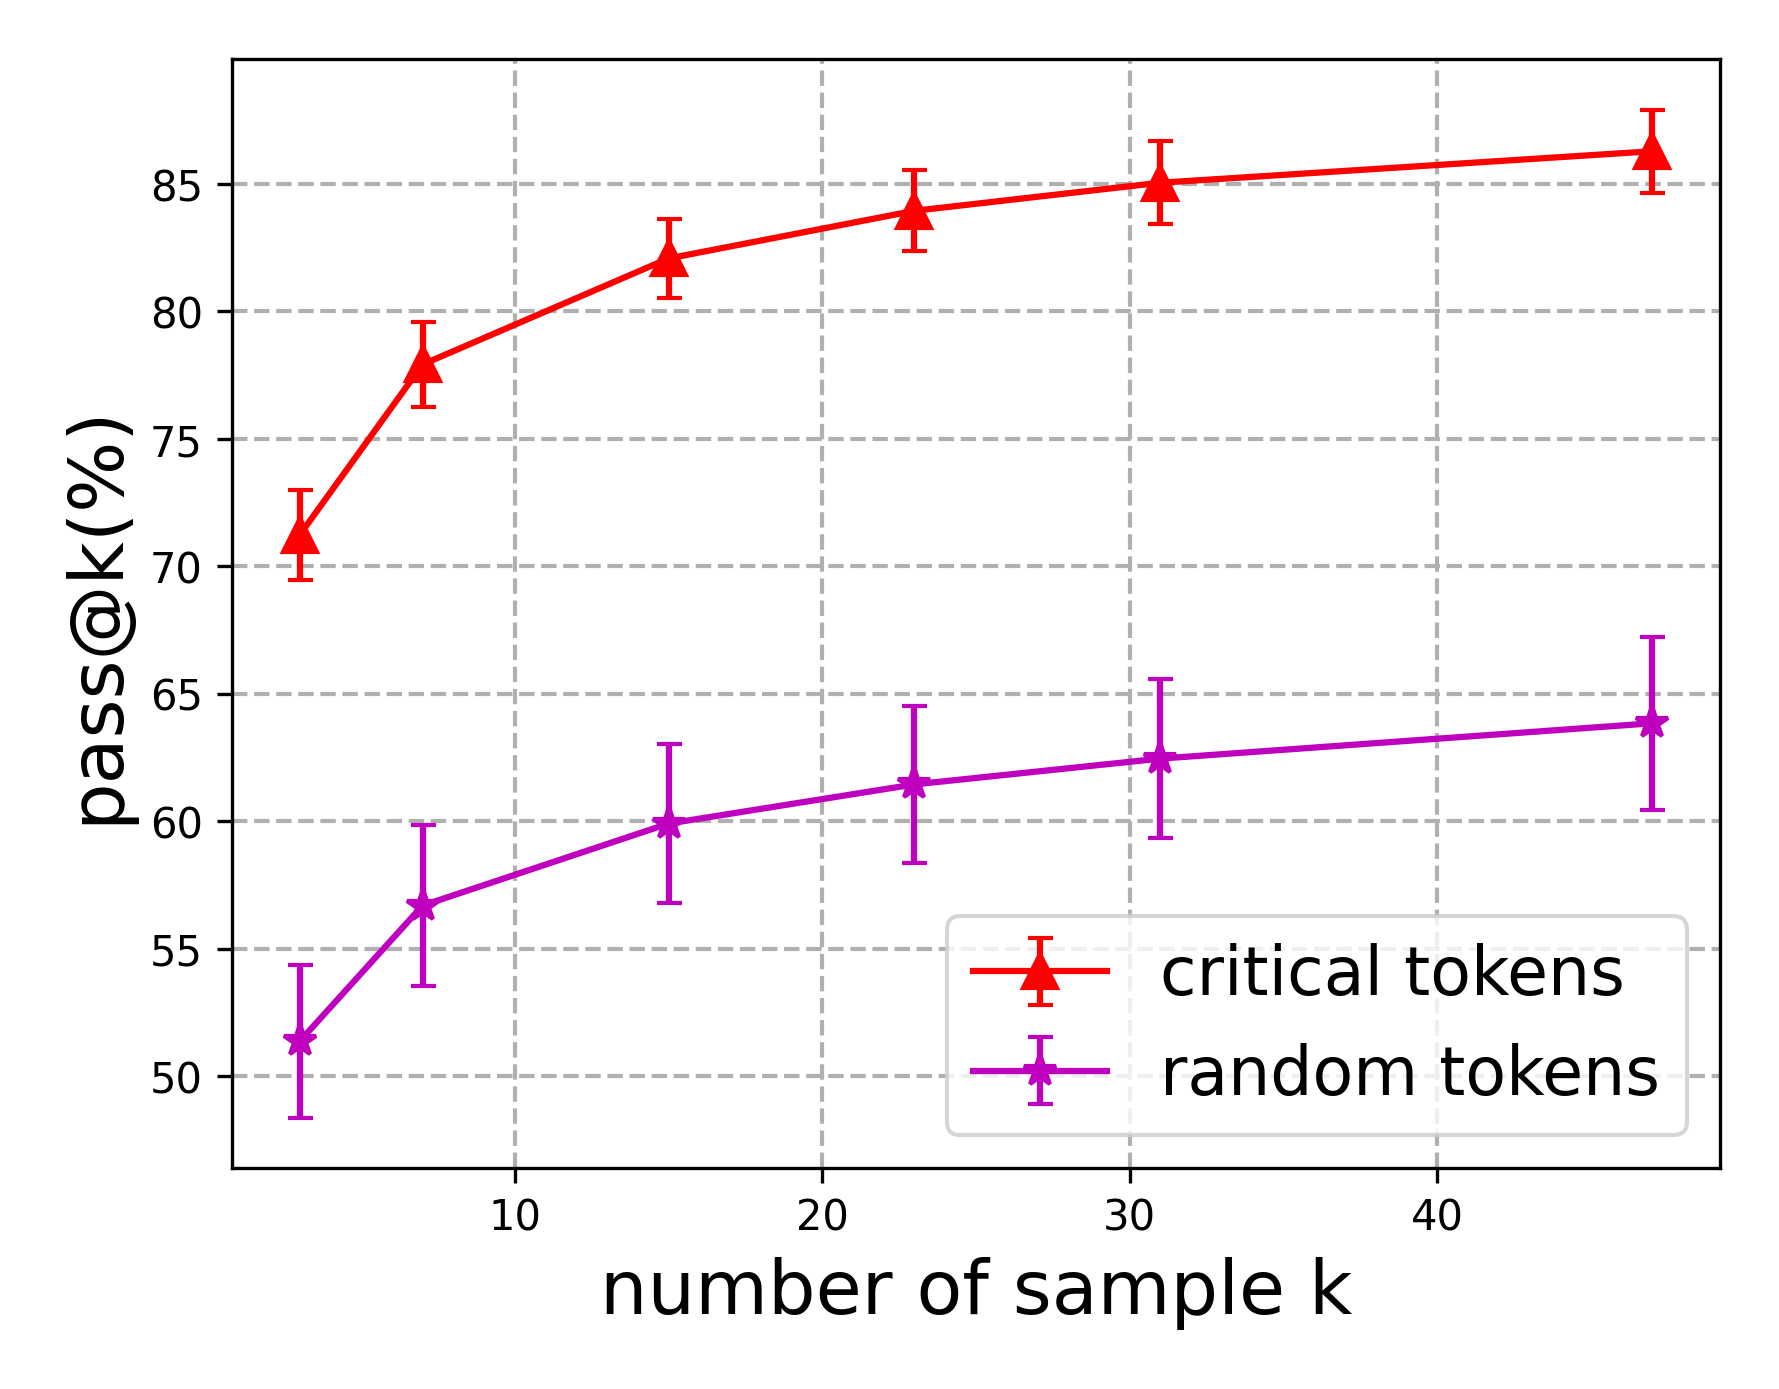
The image is a line chart comparing the performance of two methods, "critical tokens" and "random tokens," across different sample sizes (k). The performance metric is "pass@k(%)" which likely represents the percentage of problems solved correctly when given k samples. The chart includes error bars for each data point, indicating variability or confidence intervals.
### Components/Axes
* **Chart Type:** Line chart with error bars.
* **X-Axis:**
* **Label:** "number of sample k"
* **Scale:** Linear scale from approximately 0 to 50.
* **Major Tick Marks:** 10, 20, 30, 40.
* **Y-Axis:**
* **Label:** "pass@k(%)"
* **Scale:** Linear scale from 50 to approximately 88.
* **Major Tick Marks:** 50, 55, 60, 65, 70, 75, 80, 85.
* **Legend:**
* **Location:** Bottom-right corner of the plot area.
* **Series 1:** Red line with upward-pointing triangle markers, labeled "critical tokens".
* **Series 2:** Purple (magenta) line with star markers, labeled "random tokens".
* **Grid:** Dashed gray grid lines are present for both major x and y ticks.
### Detailed Analysis
**Data Series: critical tokens (Red line, triangle markers)**
* **Trend:** The line shows a clear upward trend, with a steep initial increase that gradually flattens as k increases.
* **Data Points (Approximate):**
* k ≈ 5: pass@k ≈ 71% (Error bar range: ~70% to ~73%)
* k ≈ 10: pass@k ≈ 78% (Error bar range: ~76% to ~80%)
* k ≈ 15: pass@k ≈ 82% (Error bar range: ~80.5% to ~83.5%)
* k ≈ 20: pass@k ≈ 84% (Error bar range: ~82.5% to ~85.5%)
* k ≈ 30: pass@k ≈ 85% (Error bar range: ~83.5% to ~86.5%)
* k ≈ 45: pass@k ≈ 86% (Error bar range: ~85% to ~87.5%)
**Data Series: random tokens (Purple line, star markers)**
* **Trend:** The line also shows an upward trend, but it is consistently lower than the "critical tokens" series. The slope is more gradual throughout.
* **Data Points (Approximate):**
* k ≈ 5: pass@k ≈ 51% (Error bar range: ~48% to ~54%)
* k ≈ 10: pass@k ≈ 57% (Error bar range: ~53.5% to ~60%)
* k ≈ 15: pass@k ≈ 60% (Error bar range: ~57% to ~63%)
* k ≈ 20: pass@k ≈ 61.5% (Error bar range: ~58.5% to ~64.5%)
* k ≈ 30: pass@k ≈ 62.5% (Error bar range: ~59.5% to ~65.5%)
* k ≈ 45: pass@k ≈ 64% (Error bar range: ~60.5% to ~67.5%)
### Key Observations
1. **Performance Gap:** There is a significant and consistent performance gap between the two methods. "Critical tokens" outperforms "random tokens" at every measured value of k.
2. **Diminishing Returns:** Both curves show diminishing returns. The largest performance gains for both methods occur when increasing k from 5 to 15. The improvement per additional sample becomes smaller as k grows larger.
3. **Error Bar Comparison:** The error bars for the "random tokens" series appear visually larger (especially at k=5 and k=45) than those for the "critical tokens" series. This suggests that the performance of the random method is more variable or less certain.
4. **Convergence:** The two lines do not appear to be converging. The absolute difference in pass@k between the two methods remains roughly constant (around 20-22 percentage points) across the range of k shown.
### Interpretation
This chart demonstrates the superior effectiveness of a "critical tokens" strategy over a "random tokens" strategy for the task measured by pass@k. The data suggests that intelligently selecting or focusing on "critical" tokens leads to a much higher success rate than using randomly selected tokens, regardless of the number of samples (k) considered.
The consistent gap indicates that the advantage of the critical token approach is fundamental and not merely a function of sample size. The larger error bars for the random method imply it is less reliable. The diminishing returns for both methods are typical in sampling-based approaches, but the critical token method reaches a high level of performance (over 80%) with a relatively small number of samples (k=15), making it potentially more efficient. The chart provides strong empirical evidence for prioritizing the identification and use of critical tokens in this context.