TECHNICAL ASSET FINGERPRINT
d9d66124a390dd0fdad39c8d
Click to view fullscreen
Press ESC or click to close
FOUND IN PAPERS
EXPERT: gemini-3.1-pro-preview VERSION 2
RUNTIME: nugit/gemini/gemini-3.1-pro-preview
INTEL_VERIFIED
## Pie Chart Grid: Model Performance State Transitions Across Tasks
### Overview
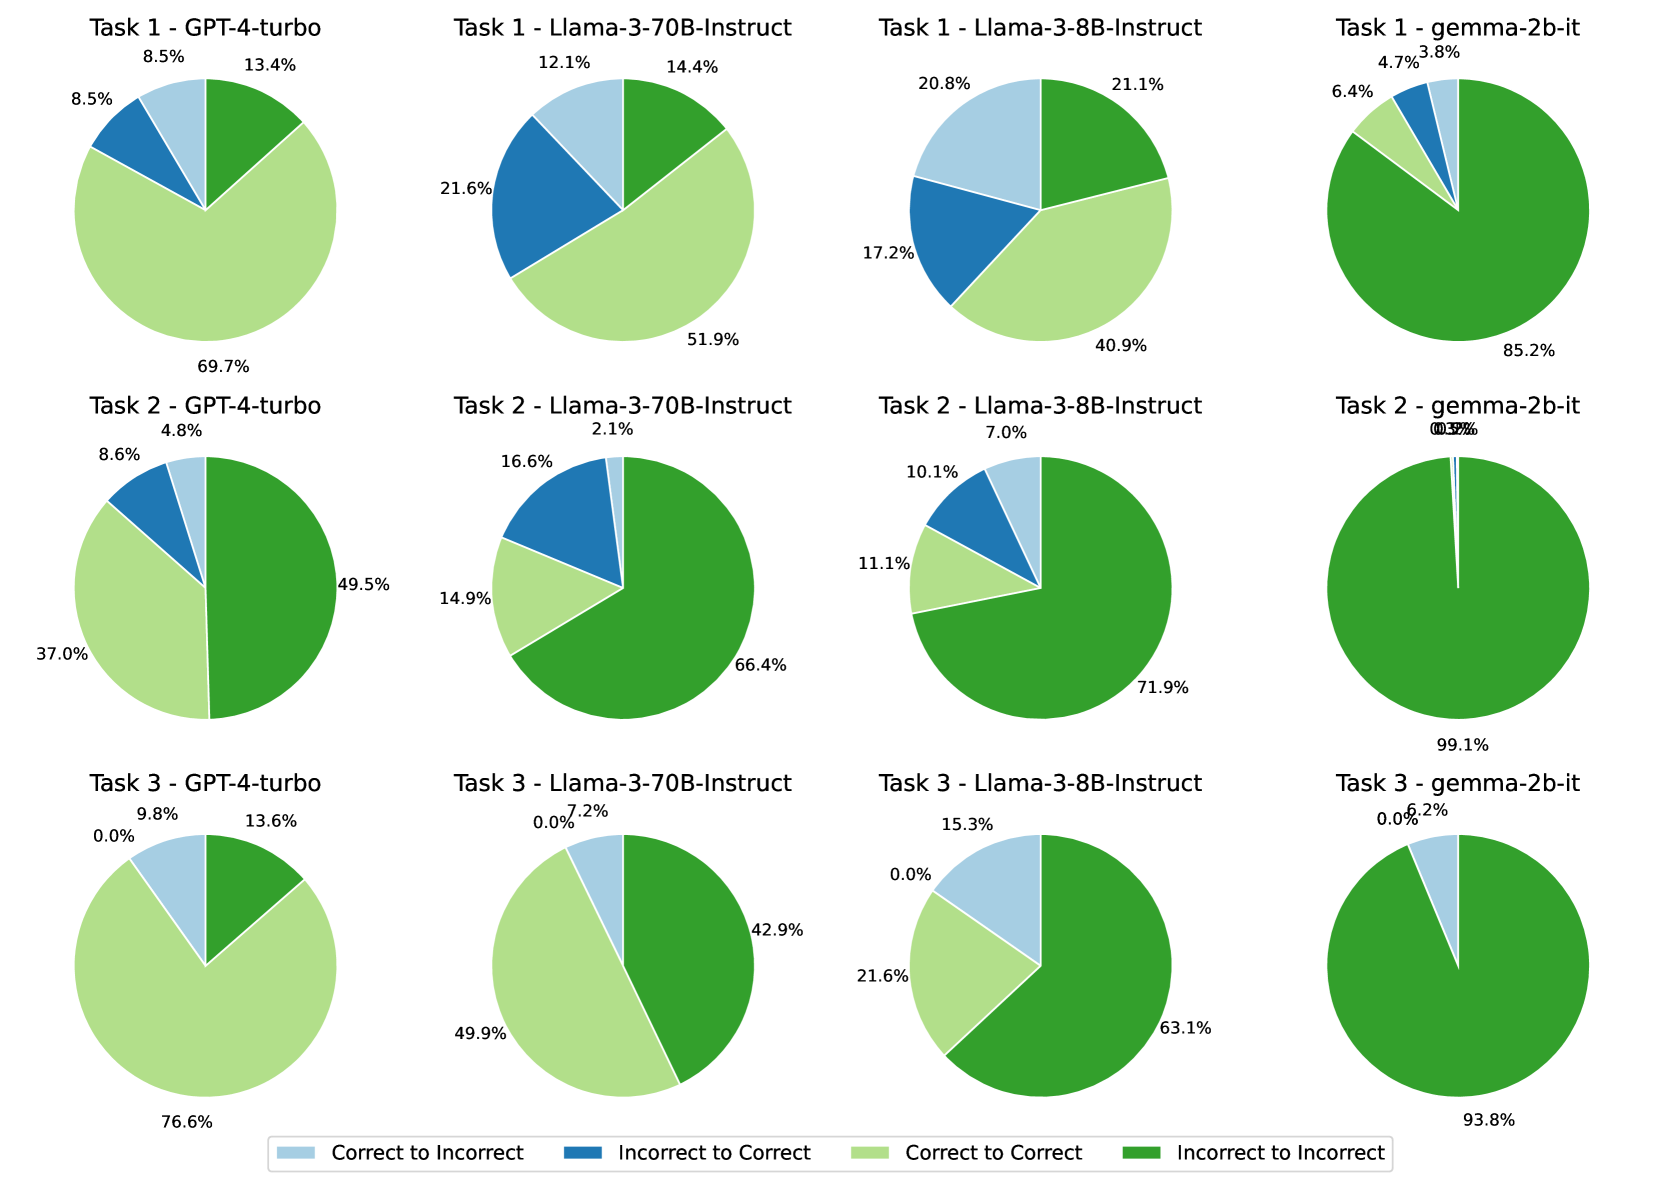
This image displays a 3x4 grid of pie charts comparing the performance of four different Large Language Models (LLMs) across three distinct tasks. The charts visualize state transitions—specifically, how a model's answer changes correctness between two states (e.g., an initial answer versus a self-corrected answer, or a base model versus an aligned model). The data illustrates varying degrees of baseline accuracy, successful correction, and negative regression across the models and tasks.
### Components/Axes
The image is divided into three main spatial regions: the Grid (Main Chart area), the Column/Row Headers, and the Legend (Footer).
**1. Layout & Headers (Spatial Grounding: Top and Left)**
* **Rows (Tasks):** The grid is divided into three horizontal rows labeled "Task 1", "Task 2", and "Task 3".
* **Columns (Models):** The grid is divided into four vertical columns representing the models tested, ordered generally from largest/most capable to smallest:
* Column 1: `GPT-4-turbo`
* Column 2: `Llama-3-70B-Instruct`
* Column 3: `Llama-3-8B-Instruct`
* Column 4: `gemma-2b-it`
**2. Legend (Spatial Grounding: Bottom Center)**
A horizontal legend at the bottom of the image defines the four colors used in the pie charts. These represent the transition of an answer's state:
* **Light Blue square:** `Correct to Incorrect` (Regression)
* **Dark Blue square:** `Incorrect to Correct` (Improvement)
* **Light Green square:** `Correct to Correct` (Maintained Accuracy)
* **Dark Green square:** `Incorrect to Incorrect` (Persistent Failure)
---
### Detailed Analysis & Content Details
*Trend Verification Methodology:* For each row, the visual distribution of colors is described from left to right to establish the trend before extracting the precise numerical percentages. Slices generally follow a clockwise placement starting from the top/top-right for Dark Green, bottom for Light Green, left for Dark Blue, and top-left for Light Blue.
#### Row 1: Task 1
* **Visual Trend:** Moving from left to right, the Light Green area (Correct to Correct) shrinks drastically, while the Dark Green area (Incorrect to Incorrect) expands to dominate the chart. The blue slices (state changes) are most prominent in the middle two Llama models.
* **GPT-4-turbo:** Dominated by Light Green (bottom).
* Correct to Incorrect (Light Blue): 8.5%
* Incorrect to Correct (Dark Blue): 8.5%
* Correct to Correct (Light Green): 69.7%
* Incorrect to Incorrect (Dark Green): 13.4%
* **Llama-3-70B-Instruct:** Light Green is roughly half; Dark Blue is a significant quarter.
* Correct to Incorrect (Light Blue): 12.1%
* Incorrect to Correct (Dark Blue): 21.6%
* Correct to Correct (Light Green): 51.9%
* Incorrect to Incorrect (Dark Green): 14.4%
* **Llama-3-8B-Instruct:** Light Green and Dark Green are roughly equal; Light Blue is prominent.
* Correct to Incorrect (Light Blue): 20.8%
* Incorrect to Correct (Dark Blue): 17.2%
* Correct to Correct (Light Green): 40.9%
* Incorrect to Incorrect (Dark Green): 21.1%
* **gemma-2b-it:** Overwhelmingly Dark Green.
* Correct to Incorrect (Light Blue): 3.8%
* Incorrect to Correct (Dark Blue): 4.7%
* Correct to Correct (Light Green): 6.4%
* Incorrect to Incorrect (Dark Green): 85.2%
#### Row 2: Task 2
* **Visual Trend:** Across all models, Task 2 shows a massive increase in Dark Green compared to Task 1, indicating higher difficulty. GPT-4-turbo is split nearly in half between green shades. Gemma is almost entirely a solid Dark Green circle.
* **GPT-4-turbo:** Dark Green takes up the right half; Light Green the bottom left.
* Correct to Incorrect (Light Blue): 4.8%
* Incorrect to Correct (Dark Blue): 8.6%
* Correct to Correct (Light Green): 37.0%
* Incorrect to Incorrect (Dark Green): 49.5%
* **Llama-3-70B-Instruct:** Dark Green dominates the right and bottom.
* Correct to Incorrect (Light Blue): 2.1%
* Incorrect to Correct (Dark Blue): 16.6%
* Correct to Correct (Light Green): 14.9%
* Incorrect to Incorrect (Dark Green): 66.4%
* **Llama-3-8B-Instruct:** Similar to the 70B model, but with slightly more Dark Green.
* Correct to Incorrect (Light Blue): 7.0%
* Incorrect to Correct (Dark Blue): 10.1%
* Correct to Correct (Light Green): 11.1%
* Incorrect to Incorrect (Dark Green): 71.9%
* **gemma-2b-it:** Visually a solid Dark Green circle. The labels for the blue slices overlap at the top.
* Correct to Incorrect (Light Blue): 0.3%
* Incorrect to Correct (Dark Blue): 0.5%
* Correct to Correct (Light Green): 0.0% (Implied by absence)
* Incorrect to Incorrect (Dark Green): 99.1%
#### Row 3: Task 3
* **Visual Trend:** The most striking visual anomaly occurs here: the Dark Blue slice (Incorrect to Correct) completely vanishes from the first three models. Light Green recovers somewhat for GPT-4 and Llama-70B compared to Task 2.
* **GPT-4-turbo:** Mostly Light Green, with a notable Light Blue slice.
* Correct to Incorrect (Light Blue): 9.8%
* Incorrect to Correct (Dark Blue): 0.0%
* Correct to Correct (Light Green): 76.6%
* Incorrect to Incorrect (Dark Green): 13.6%
* **Llama-3-70B-Instruct:** Split almost evenly between Light Green and Dark Green.
* Correct to Incorrect (Light Blue): 7.2%
* Incorrect to Correct (Dark Blue): 0.0%
* Correct to Correct (Light Green): 49.9%
* Incorrect to Incorrect (Dark Green): 42.9%
* **Llama-3-8B-Instruct:** Dark Green dominates, with a significant Light Blue slice.
* Correct to Incorrect (Light Blue): 15.3%
* Incorrect to Correct (Dark Blue): 0.0%
* Correct to Correct (Light Green): 21.6%
* Incorrect to Incorrect (Dark Green): 63.1%
* **gemma-2b-it:** Almost entirely Dark Green, with a small Light Blue slice.
* Correct to Incorrect (Light Blue): 6.2%
* Incorrect to Correct (Dark Blue): 0.0%
* Correct to Correct (Light Green): 0.0%
* Incorrect to Incorrect (Dark Green): 93.8%
#### Reconstructed Data Table
| Task | Model | Correct -> Incorrect (Light Blue) | Incorrect -> Correct (Dark Blue) | Correct -> Correct (Light Green) | Incorrect -> Incorrect (Dark Green) |
| :--- | :--- | :--- | :--- | :--- | :--- |
| **Task 1** | GPT-4-turbo | 8.5% | 8.5% | 69.7% | 13.4% |
| | Llama-3-70B-Instruct | 12.1% | 21.6% | 51.9% | 14.4% |
| | Llama-3-8B-Instruct | 20.8% | 17.2% | 40.9% | 21.1% |
| | gemma-2b-it | 3.8% | 4.7% | 6.4% | 85.2% |
| **Task 2** | GPT-4-turbo | 4.8% | 8.6% | 37.0% | 49.5% |
| | Llama-3-70B-Instruct | 2.1% | 16.6% | 14.9% | 66.4% |
| | Llama-3-8B-Instruct | 7.0% | 10.1% | 11.1% | 71.9% |
| | gemma-2b-it | 0.3% | 0.5% | 0.0% | 99.1% |
| **Task 3** | GPT-4-turbo | 9.8% | 0.0% | 76.6% | 13.6% |
| | Llama-3-70B-Instruct | 7.2% | 0.0% | 49.9% | 42.9% |
| | Llama-3-8B-Instruct | 15.3% | 0.0% | 21.6% | 63.1% |
| | gemma-2b-it | 6.2% | 0.0% | 0.0% | 93.8% |
---
### Key Observations
1. **Model Capability Hierarchy:** There is a clear correlation between presumed model size/capability and performance. GPT-4-turbo consistently has the highest "Correct to Correct" (Light Green) rates. Gemma-2b-it consistently has the highest "Incorrect to Incorrect" (Dark Green) rates, failing almost entirely on Tasks 2 and 3.
2. **Task Difficulty:** Task 2 is universally the most difficult task. Even GPT-4-turbo drops from 69.7% baseline accuracy (Task 1) to 37.0% (Task 2).
3. **The Task 3 Anomaly:** In Task 3, the "Incorrect to Correct" (Dark Blue) metric drops to exactly 0.0% across all four models. None of the models were able to transition a wrong answer to a right answer in this specific task.
4. **Llama's Volatility in Task 1:** The Llama models show the highest rates of state transition (both blue slices) in Task 1. Llama-3-70B successfully corrected itself 21.6% of the time, but also broke correct answers 12.1% of the time.
### Interpretation
This chart likely visualizes an experiment involving a two-pass LLM system—such as a model generating an initial answer, and then being prompted to reflect, self-correct, or use a different reasoning pathway.
* **Light Green (C->C)** represents the model's robust baseline knowledge; it knew the answer and didn't second-guess itself.
* **Dark Green (I->I)** represents a hard failure; the model lacks the knowledge or reasoning capability to solve the prompt, regardless of the second pass. Gemma-2b-it's near 100% Dark Green on Tasks 2 and 3 indicates these tasks are entirely outside its capability threshold.
* **Dark Blue (I->C)** represents the ideal outcome of a self-correction or multi-agent workflow: the model successfully identified and fixed its own error. Llama-3-70B is notably the best at this specific behavior (Task 1 and 2).
* **Light Blue (C->I)** represents negative interference or "hallucination" during reflection. The model had the right answer but was talked out of it (or talked itself out of it) during the second pass.
**Peircean Investigative Reading:** The most fascinating data point is the 0.0% "Incorrect to Correct" rate across all models in Task 3. This suggests a fundamental characteristic of Task 3's design. It is likely a "brittle" task—perhaps a strict logic puzzle, a math problem with a specific trap, or a task where the evaluation metric is unforgiving. The data shows that if a model gets Task 3 wrong on the first try, the secondary intervention *cannot* save it. Furthermore, because the "Correct to Incorrect" (Light Blue) slice still exists in Task 3 (ranging from 6.2% to 15.3%), the secondary intervention is actively harmful to models that initially got it right. This implies that whatever prompting strategy is being tested for self-correction is highly ineffective, and potentially detrimental, for the specific cognitive demands of Task 3.
DECODING INTELLIGENCE...