TECHNICAL ASSET FINGERPRINT
d9d66124a390dd0fdad39c8d
Click to view fullscreen
Press ESC or click to close
FOUND IN PAPERS
EXPERT: healer-alpha-free VERSION 1
RUNTIME: free/openrouter/healer-alpha
INTEL_VERIFIED
## Comparative Pie Chart Grid: AI Model Performance Across Three Tasks
### Overview
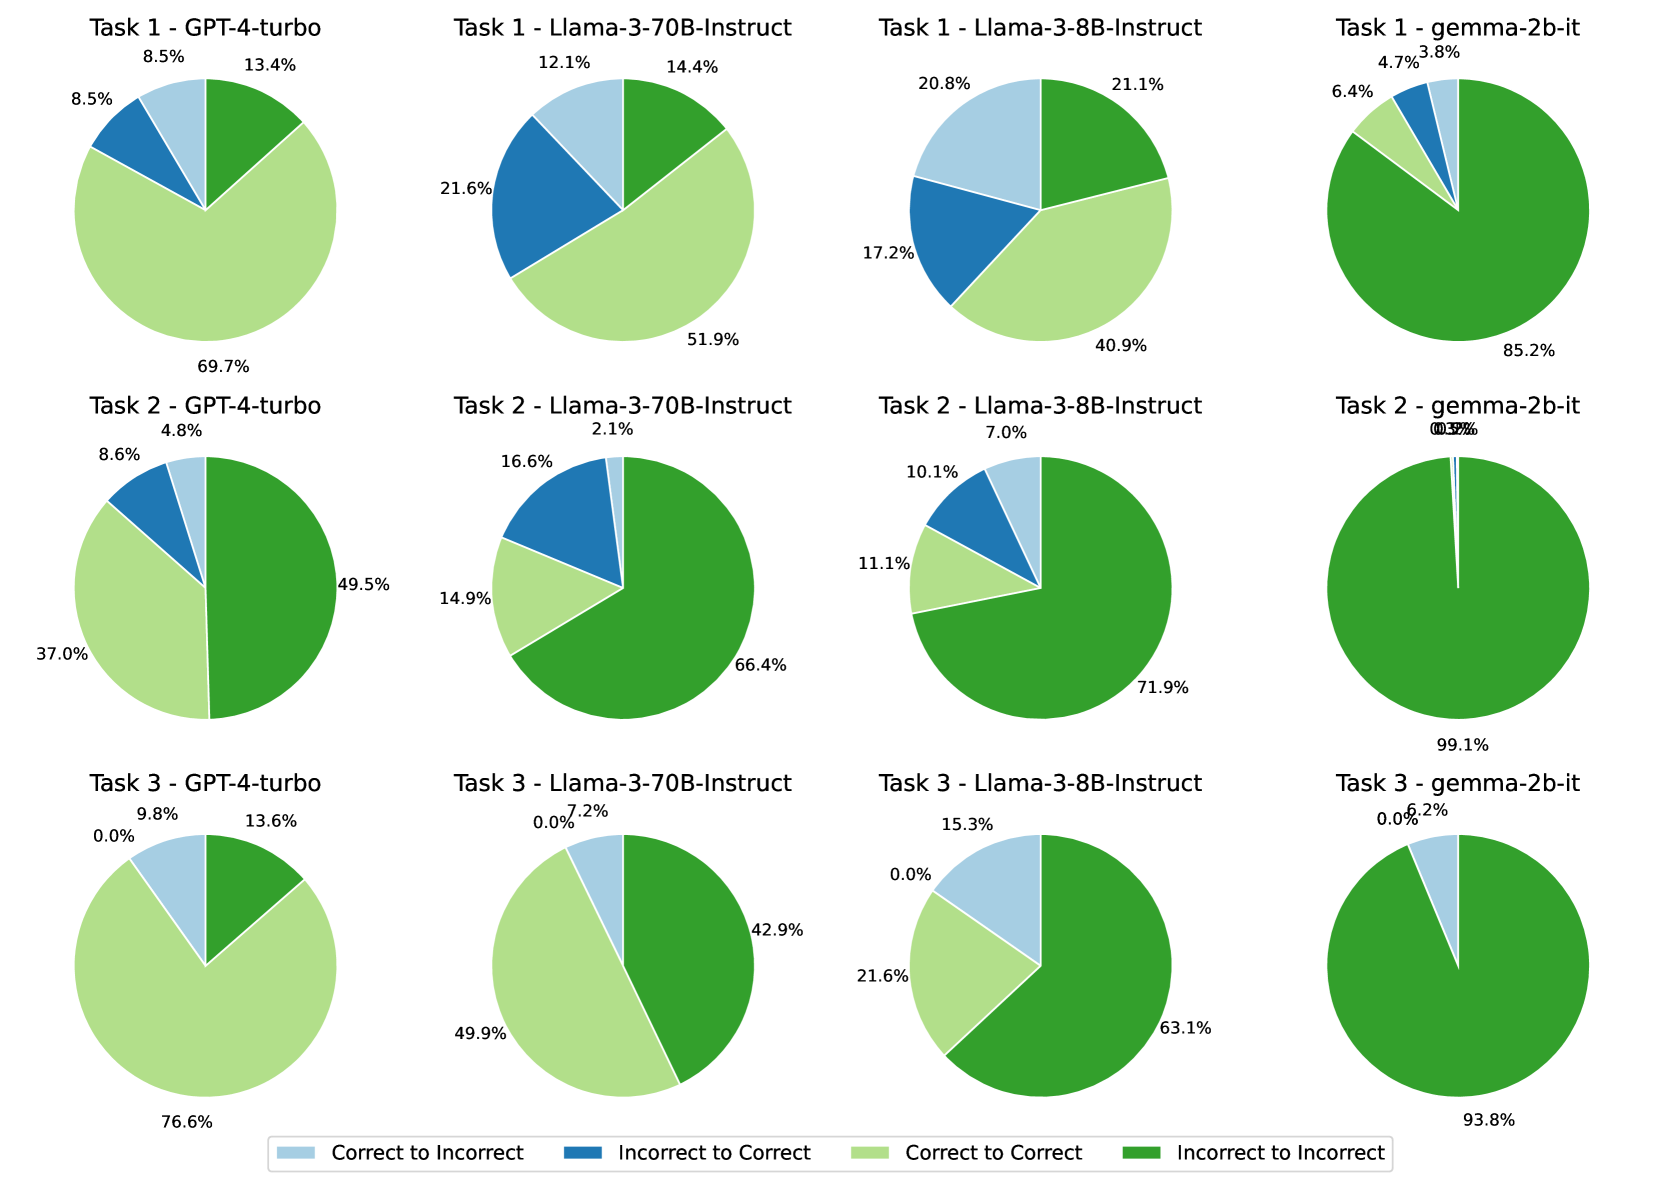
The image displays a 3x4 grid of pie charts, comparing the performance of four different AI models (GPT-4-turbo, Llama-3-70B-Instruct, Llama-3-8B-Instruct, and gemma-2b-it) across three distinct tasks (Task 1, Task 2, Task 3). Each pie chart breaks down the model's performance into four categories, representing the transition of answer correctness. A legend at the bottom defines these categories.
### Components/Axes
* **Grid Structure:** The charts are arranged in three rows (one per Task) and four columns (one per Model).
* **Chart Titles:** Each pie chart is titled with the format "Task [Number] - [Model Name]".
* **Legend:** Located at the bottom center of the image. It defines four color-coded categories:
* Light Blue: `Correct to Incorrect`
* Dark Blue: `Incorrect to Correct`
* Light Green: `Correct to Correct`
* Dark Green: `Incorrect to Incorrect`
* **Data Labels:** Each pie chart segment is labeled with a percentage value.
### Detailed Analysis
**Row 1: Task 1**
* **GPT-4-turbo (Top-Left):**
* Correct to Incorrect (Light Blue): 8.5%
* Incorrect to Correct (Dark Blue): 8.5%
* Correct to Correct (Light Green): 69.7%
* Incorrect to Incorrect (Dark Green): 13.4%
* **Llama-3-70B-Instruct (Top-Center-Left):**
* Correct to Incorrect (Light Blue): 12.1%
* Incorrect to Correct (Dark Blue): 21.6%
* Correct to Correct (Light Green): 51.9%
* Incorrect to Incorrect (Dark Green): 14.4%
* **Llama-3-8B-Instruct (Top-Center-Right):**
* Correct to Incorrect (Light Blue): 20.8%
* Incorrect to Correct (Dark Blue): 17.2%
* Correct to Correct (Light Green): 40.9%
* Incorrect to Incorrect (Dark Green): 21.1%
* **gemma-2b-it (Top-Right):**
* Correct to Incorrect (Light Blue): 6.4%
* Incorrect to Correct (Dark Blue): 4.7%
* Correct to Correct (Light Green): 3.8%
* Incorrect to Incorrect (Dark Green): 85.2%
**Row 2: Task 2**
* **GPT-4-turbo (Middle-Left):**
* Correct to Incorrect (Light Blue): 4.8%
* Incorrect to Correct (Dark Blue): 8.6%
* Correct to Correct (Light Green): 37.0%
* Incorrect to Incorrect (Dark Green): 49.5%
* **Llama-3-70B-Instruct (Middle-Center-Left):**
* Correct to Incorrect (Light Blue): 2.1%
* Incorrect to Correct (Dark Blue): 16.6%
* Correct to Correct (Light Green): 14.9%
* Incorrect to Incorrect (Dark Green): 66.4%
* **Llama-3-8B-Instruct (Middle-Center-Right):**
* Correct to Incorrect (Light Blue): 7.0%
* Incorrect to Correct (Dark Blue): 10.1%
* Correct to Correct (Light Green): 11.1%
* Incorrect to Incorrect (Dark Green): 71.9%
* **gemma-2b-it (Middle-Right):**
* Correct to Incorrect (Light Blue): 0.0% (Value label is partially obscured/overlapping with "Incorrect to Correct" label, appears as "0.0% 0.9%").
* Incorrect to Correct (Dark Blue): 0.9% (Approximate, based on overlapping label).
* Correct to Correct (Light Green): 0.0% (Not visibly labeled, inferred from chart).
* Incorrect to Incorrect (Dark Green): 99.1%
**Row 3: Task 3**
* **GPT-4-turbo (Bottom-Left):**
* Correct to Incorrect (Light Blue): 9.8%
* Incorrect to Correct (Dark Blue): 0.0%
* Correct to Correct (Light Green): 76.6%
* Incorrect to Incorrect (Dark Green): 13.6%
* **Llama-3-70B-Instruct (Bottom-Center-Left):**
* Correct to Incorrect (Light Blue): 7.2%
* Incorrect to Correct (Dark Blue): 0.0%
* Correct to Correct (Light Green): 49.9%
* Incorrect to Incorrect (Dark Green): 42.9%
* **Llama-3-8B-Instruct (Bottom-Center-Right):**
* Correct to Incorrect (Light Blue): 15.3%
* Incorrect to Correct (Dark Blue): 0.0%
* Correct to Correct (Light Green): 21.6%
* Incorrect to Incorrect (Dark Green): 63.1%
* **gemma-2b-it (Bottom-Right):**
* Correct to Incorrect (Light Blue): 6.2%
* Incorrect to Correct (Dark Blue): 0.0%
* Correct to Correct (Light Green): 0.0% (Not visibly labeled, inferred from chart).
* Incorrect to Incorrect (Dark Green): 93.8%
### Key Observations
1. **Model Performance Hierarchy:** Across all tasks, GPT-4-turbo and Llama-3-70B-Instruct consistently show higher percentages of "Correct to Correct" (Light Green) responses compared to the smaller models, Llama-3-8B-Instruct and gemma-2b-it.
2. **Task Difficulty:** Task 2 appears to be the most challenging for all models, as indicated by the significantly lower "Correct to Correct" percentages and higher "Incorrect to Incorrect" (Dark Green) percentages compared to Tasks 1 and 3.
3. **gemma-2b-it Performance:** The gemma-2b-it model shows extreme results. For Task 1 and Task 2, it is overwhelmingly in the "Incorrect to Incorrect" category (85.2% and 99.1%, respectively). For Task 3, it is 93.8% "Incorrect to Incorrect" with a small 6.2% "Correct to Incorrect" segment. It shows minimal to no "Correct to Correct" or "Incorrect to Correct" responses.
4. **Stability vs. Change:** The "Correct to Correct" and "Incorrect to Incorrect" categories represent stable states (the model's answer did not change correctness), while "Correct to Incorrect" and "Incorrect to Correct" represent changes. Larger models show more stability in correctness (higher "Correct to Correct").
5. **Data Anomaly:** The pie chart for "Task 2 - gemma-2b-it" has overlapping and partially illegible percentage labels for the two smallest segments, making precise extraction difficult.
### Interpretation
This grid of pie charts provides a nuanced view of model performance beyond simple accuracy. It categorizes outcomes based on the *change* in correctness, likely comparing model outputs to a ground truth or a previous iteration.
* **What the data suggests:** The data demonstrates a clear correlation between model scale/capability and performance stability. Larger models (GPT-4-turbo, Llama-3-70B) are not only more often correct but are also more *consistently* correct ("Correct to Correct"). Conversely, the smallest model (gemma-2b-it) is consistently incorrect and stable in its incorrectness ("Incorrect to Incorrect") across all tasks, suggesting a fundamental capability gap for these specific tasks.
* **Relationship between elements:** The rows (Tasks) allow for comparison of how the same model performs on different problems. The columns (Models) allow for direct comparison of different models on the same problem. The color categories reveal the dynamics of model performance—whether errors are persistent or if the model can correct them.
* **Notable trends:** The most striking trend is the performance cliff between the 8B and 2B parameter models. While Llama-3-8B-Instruct shows a mix of outcomes, gemma-2b-it fails almost completely on these tasks. Another key trend is the increased difficulty of Task 2, which suppresses the "Correct to Correct" rate for all models and inflates the "Incorrect to Incorrect" rate.
* **Underlying information:** This visualization is likely from a study on model robustness, self-correction, or consistency. The "Correct to Incorrect" category is particularly interesting, as it may indicate cases where a model initially had the right answer but was led astray, perhaps by a chain-of-thought process or a secondary evaluation. The near-zero "Incorrect to Correct" values for Task 3 across all models suggest that for this specific task, if a model is initially wrong, it has virtually no chance of self-correcting to a right answer.
DECODING INTELLIGENCE...