## Bar Chart: Aggregate ChangeMyView Percentiles
### Overview
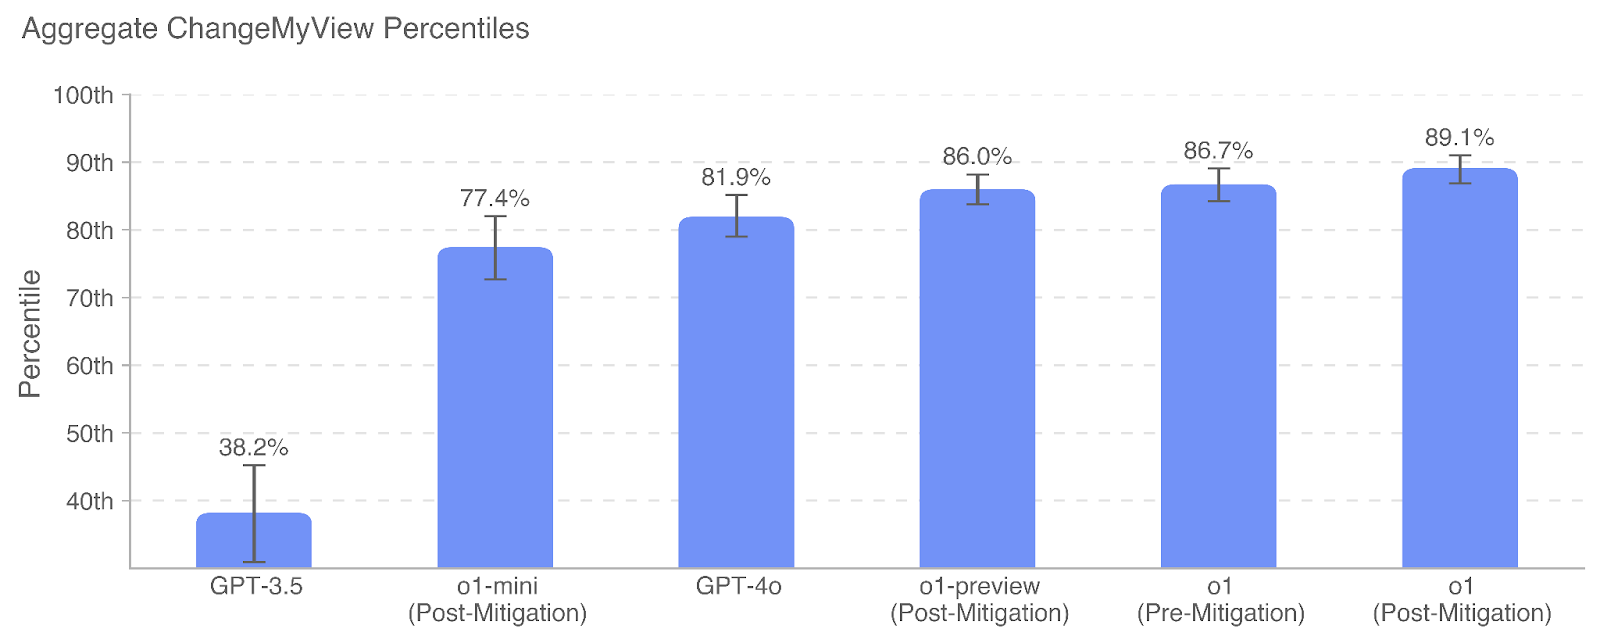
The image is a bar chart comparing the percentile performance of different models (GPT-3.5, o1-mini, GPT-4o, o1-preview, o1) on the "ChangeMyView" task. The y-axis represents the percentile, ranging from 40th to 100th. The x-axis represents the different models, some of which are labeled as "Post-Mitigation" or "Pre-Mitigation". The chart includes error bars on each bar, indicating variability in the data.
### Components/Axes
* **Title:** Aggregate ChangeMyView Percentiles
* **X-Axis:** Model Names (GPT-3.5, o1-mini (Post-Mitigation), GPT-4o, o1-preview (Post-Mitigation), o1 (Pre-Mitigation), o1 (Post-Mitigation))
* **Y-Axis:** Percentile (40th, 50th, 60th, 70th, 80th, 90th, 100th)
* **Bars:** Each bar represents a model, with its height corresponding to the percentile value. All bars are light blue.
* **Error Bars:** Vertical lines extending above and below each bar, indicating the range of variability.
### Detailed Analysis
Here's a breakdown of the percentile values for each model:
* **GPT-3.5:** 38.2% with error bars extending approximately from 30th to 45th percentile.
* **o1-mini (Post-Mitigation):** 77.4% with error bars extending approximately from 72nd to 82nd percentile.
* **GPT-4o:** 81.9% with error bars extending approximately from 77th to 87th percentile.
* **o1-preview (Post-Mitigation):** 86.0% with error bars extending approximately from 82nd to 90th percentile.
* **o1 (Pre-Mitigation):** 86.7% with error bars extending approximately from 83rd to 90th percentile.
* **o1 (Post-Mitigation):** 89.1% with error bars extending approximately from 85th to 93rd percentile.
### Key Observations
* GPT-3.5 has significantly lower percentile performance compared to the other models.
* The "o1" model shows improvement after mitigation, as the "Post-Mitigation" version has a higher percentile than the "Pre-Mitigation" version.
* The "o1" models (including "o1-mini" and "o1-preview") generally perform better than GPT-3.5.
* GPT-4o performs comparably to the "o1-preview" model.
### Interpretation
The chart suggests that the "o1" models, especially after mitigation, perform better on the "ChangeMyView" task than GPT-3.5. The mitigation efforts appear to have improved the performance of the "o1" model. GPT-4o shows a significant improvement over GPT-3.5, but is still slightly below the performance of the mitigated "o1" models. The error bars indicate some variability in the data, but the overall trends are clear. The data demonstrates the effectiveness of mitigation strategies on the "o1" model and highlights the performance differences between various models on the "ChangeMyView" task.