\n
## Bar Chart: Aggregate ChangeMyView Percentiles
### Overview
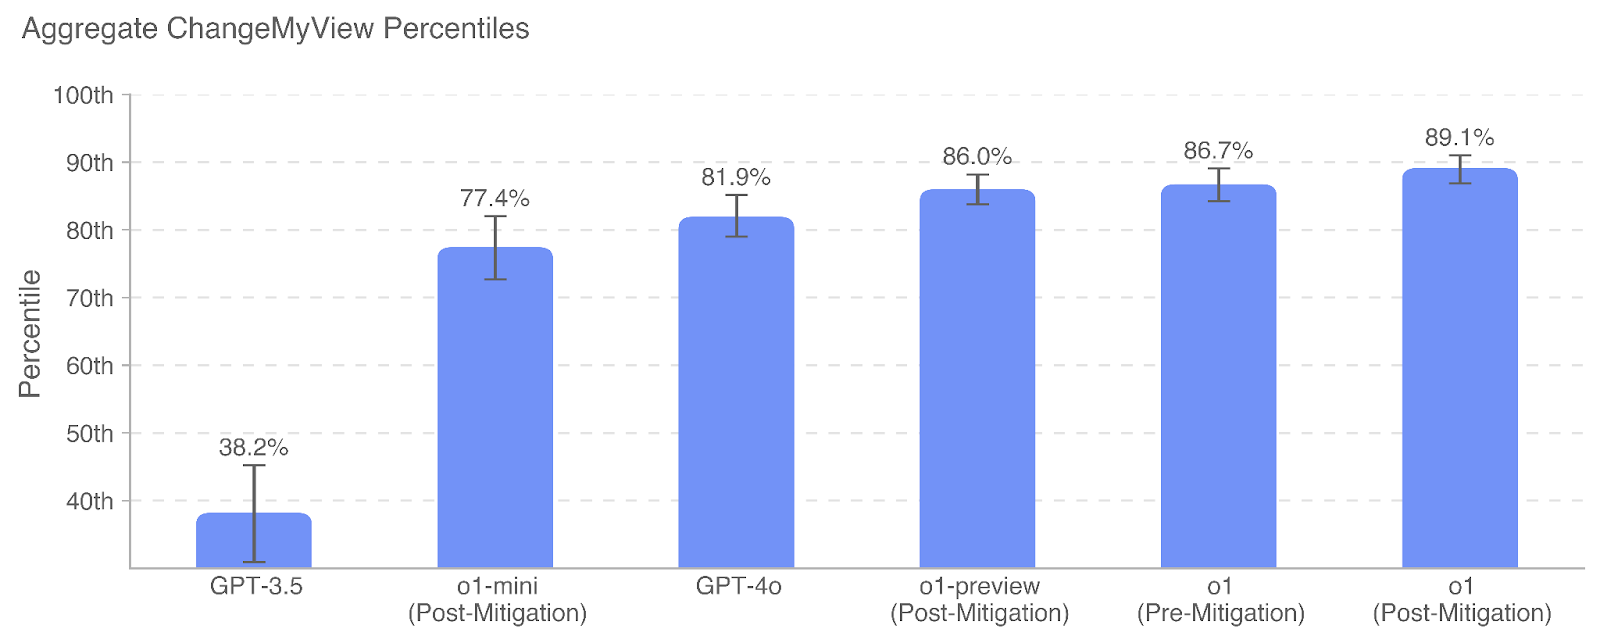
This is a vertical bar chart titled "Aggregate ChangeMyView Percentiles." It displays the performance percentile of six different AI models or model variants on a task or benchmark related to "ChangeMyView." The chart includes error bars for each data point, indicating variability or confidence intervals. The overall trend shows a significant increase in percentile performance from the earliest model listed to the most recent variants.
### Components/Axes
* **Chart Title:** "Aggregate ChangeMyView Percentiles" (located at the top-left).
* **Y-Axis:**
* **Label:** "Percentile" (rotated vertically on the left side).
* **Scale:** Linear scale from 40th to 100th percentile, with major gridlines at 10th percentile intervals (40th, 50th, 60th, 70th, 80th, 90th, 100th).
* **X-Axis:**
* **Labels (from left to right):**
1. GPT-3.5
2. o1-mini (Post-Mitigation)
3. GPT-4o
4. o1-preview (Post-Mitigation)
5. o1 (Pre-Mitigation)
6. o1 (Post-Mitigation)
* **Data Series:** A single series represented by blue bars. Each bar has a black error bar (I-beam style) extending above and below the top of the bar.
* **Data Labels:** The exact percentile value is printed above each bar.
### Detailed Analysis
The chart presents the following data points, listed from left to right:
1. **GPT-3.5:**
* **Percentile:** 38.2%
* **Error Bar:** Extends from approximately the 35th to the 42nd percentile (visual estimate).
* **Trend:** This is the lowest-performing model by a significant margin.
2. **o1-mini (Post-Mitigation):**
* **Percentile:** 77.4%
* **Error Bar:** Extends from approximately the 73rd to the 82nd percentile.
* **Trend:** A substantial increase of ~39.2 percentage points from GPT-3.5.
3. **GPT-4o:**
* **Percentile:** 81.9%
* **Error Bar:** Extends from approximately the 79th to the 85th percentile.
* **Trend:** A moderate increase of ~4.5 percentage points from o1-mini.
4. **o1-preview (Post-Mitigation):**
* **Percentile:** 86.0%
* **Error Bar:** Extends from approximately the 84th to the 88th percentile.
* **Trend:** An increase of ~4.1 percentage points from GPT-4o.
5. **o1 (Pre-Mitigation):**
* **Percentile:** 86.7%
* **Error Bar:** Extends from approximately the 84th to the 89th percentile.
* **Trend:** A slight increase of ~0.7 percentage points from o1-preview. This is the "Pre-Mitigation" version of the o1 model.
6. **o1 (Post-Mitigation):**
* **Percentile:** 89.1%
* **Error Bar:** Extends from approximately the 87th to the 91st percentile.
* **Trend:** An increase of ~2.4 percentage points from the "Pre-Mitigation" version of the same model. This is the highest-performing variant shown.
**Overall Trend:** The data series shows a clear, monotonic upward trend from left to right. The most dramatic performance jump occurs between GPT-3.5 and the first o1-mini variant. Subsequent improvements are more incremental but consistent.
### Key Observations
1. **Performance Hierarchy:** There is a clear performance hierarchy: GPT-3.5 << o1-mini < GPT-4o < o1-preview < o1 (Pre-Mitigation) < o1 (Post-Mitigation).
2. **Impact of Mitigation:** For the "o1" model, the "Post-Mitigation" variant (89.1%) outperforms the "Pre-Mitigation" variant (86.7%), suggesting the mitigation technique improved performance on this benchmark by approximately 2.4 percentile points.
3. **Error Bar Variability:** The length of the error bars (uncertainty) appears relatively consistent across the higher-performing models (o1-mini through o1), suggesting similar levels of variance in their results. The error bar for GPT-3.5 is proportionally larger relative to its score.
4. **Clustering:** The four highest-performing models (GPT-4o, o1-preview, o1 Pre, o1 Post) are clustered within a ~7.2 percentile point range (81.9% to 89.1%), indicating competitive performance among these advanced models.
### Interpretation
This chart likely visualizes the results of an evaluation measuring AI model capabilities on the "ChangeMyView" task, which probably involves analyzing or generating content related to the Reddit forum r/ChangeMyView, a platform for persuasive argumentation.
* **What the data suggests:** The data demonstrates a strong positive trajectory in model capability over successive generations (GPT-3.5 -> GPT-4o -> o1 series). The "o1" model family shows particularly high performance.
* **Relationship between elements:** The x-axis represents a progression of model development, likely in chronological or complexity order. The y-axis quantifies a specific performance metric (percentile rank). The "Pre-Mitigation" vs. "Post-Mitigation" labels for the o1 model indicate an A/B test of a specific safety or alignment technique, showing it had a positive effect on this benchmark.
* **Notable trends/anomalies:** The most notable trend is the massive leap from GPT-3.5 to the o1-mini model, which may represent a fundamental architectural or training data shift. There are no obvious anomalies; the progression is smooth and logical. The chart effectively communicates that newer models, especially with applied mitigations, are significantly more capable on this specific task than their predecessors.