## Bar Chart: Aggregate ChangeMyView Percentiles
### Overview
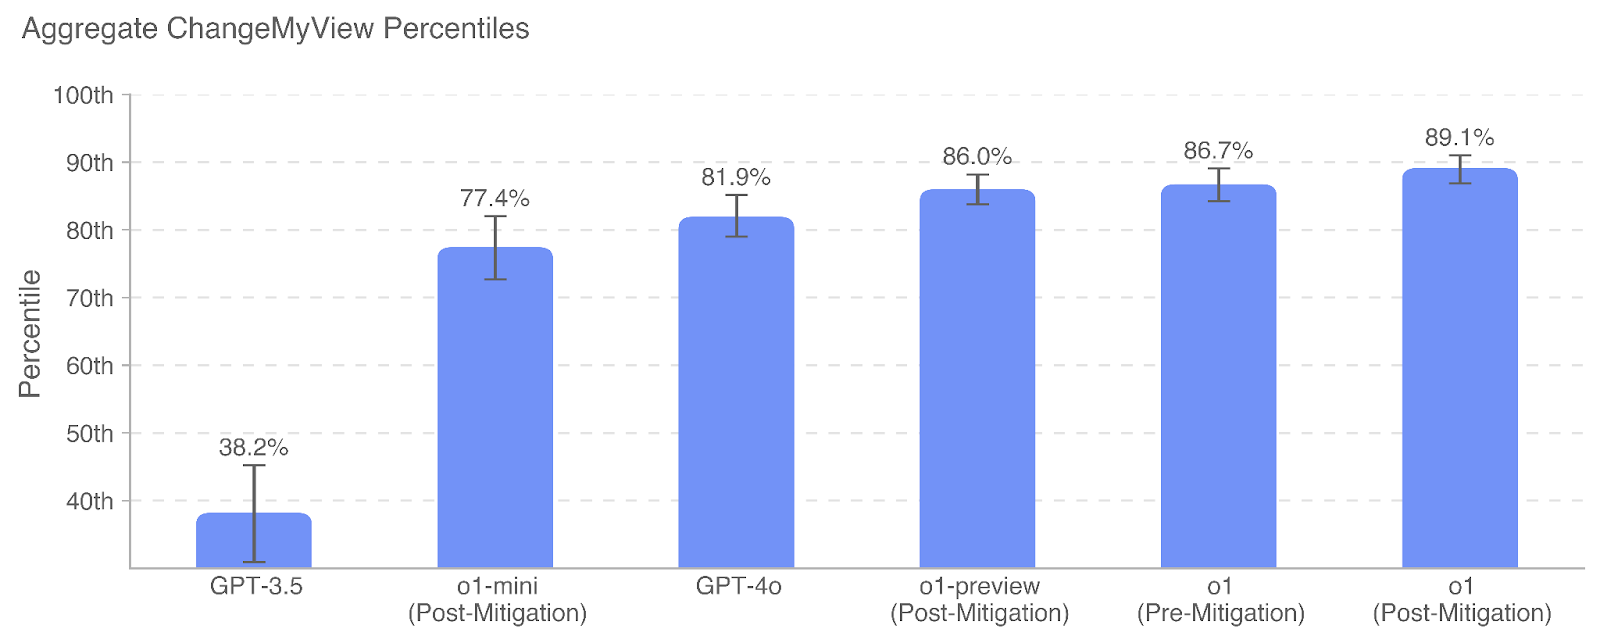
The chart visualizes percentile rankings for different AI models (GPT-3.5, o1-mini, GPT-4o, o1-preview, o1) across two mitigation phases (Pre-Mitigation and Post-Mitigation). Percentile values range from 30th to 100th, with error bars indicating variability.
### Components/Axes
- **X-Axis**: Model names and mitigation status:
- GPT-3.5
- o1-mini (Post-Mitigation)
- GPT-4o
- o1-preview (Post-Mitigation)
- o1 (Pre-Mitigation)
- o1 (Post-Mitigation)
- **Y-Axis**: Percentile scale (30th to 100th, increments of 10th).
- **Bars**: Blue vertical bars with error bars (black lines with caps).
- **Text Labels**: Percentages (e.g., 38.2%, 77.4%) and error margins (e.g., ±5.1%, ±4.2%) displayed above bars.
- **Title**: "Aggregate ChangeMyView Percentiles" (top-center, black text).
- **Gridlines**: Light gray horizontal lines for reference.
### Detailed Analysis
1. **GPT-3.5**:
- Percentile: 38.2% (±5.1%).
- Position: Bottom-left, shortest bar.
2. **o1-mini (Post-Mitigation)**:
- Percentile: 77.4% (±4.2%).
- Position: Second from left, significant jump from GPT-3.5.
3. **GPT-4o**:
- Percentile: 81.9% (±3.8%).
- Position: Third from left, incremental improvement over o1-mini.
4. **o1-preview (Post-Mitigation)**:
- Percentile: 86.0% (±3.5%).
- Position: Fourth from left, further improvement.
5. **o1 (Pre-Mitigation)**:
- Percentile: 86.7% (±3.2%).
- Position: Fifth from left, near o1-preview.
6. **o1 (Post-Mitigation)**:
- Percentile: 89.1% (±2.9%).
- Position: Rightmost, highest percentile.
### Key Observations
- **Upward Trend**: Percentiles increase from GPT-3.5 (38.2%) to o1 (89.1%), indicating performance improvement across models.
- **Mitigation Impact**:
- o1-mini and o1-preview show post-mitigation gains (77.4% → 86.0%).
- o1’s post-mitigation value (89.1%) exceeds its pre-mitigation value (86.7%).
- **Error Bars**: Smaller error margins for newer models (e.g., o1: ±2.9%) suggest higher consistency.
### Interpretation
The data demonstrates that newer AI models (e.g., o1) achieve higher percentile rankings, likely due to architectural improvements or mitigation strategies. Post-mitigation adjustments consistently boost performance, with o1 showing the most significant gains. The error bars highlight reduced variability in newer models, suggesting more reliable outcomes. The stark contrast between GPT-3.5 (38.2%) and o1 (89.1%) underscores rapid advancements in AI capabilities over time. The absence of a legend implies uniform data representation, with color (blue) and error bars serving as visual cues for comparison.