# Technical Document Extraction: Fairness-Aware Predictive System
## Diagram Overview
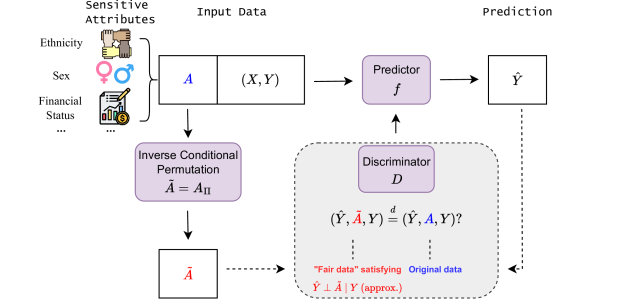
The image depicts a **fairness-aware predictive system** designed to mitigate bias in machine learning models. The workflow involves sensitive attribute handling, inverse conditional permutation, prediction, and fairness validation via a discriminator.
---
## Key Components & Flow
### 1. **Sensitive Attributes**
- **Labels**: Ethnicity, Sex, Financial Status (represented by icons: handshake, gender symbols, and financial charts).
- **Purpose**: Identifies protected attributes that could introduce bias into predictions.
### 2. **Input Data**
- **Structure**:
- **A**: Sensitive attributes (Ethnicity, Sex, Financial Status).
- **(X, Y)**: Feature matrix (X) and target variable (Y).
- **Flow**: Input data (A, X, Y) is processed through the system.
### 3. **Inverse Conditional Permutation**
- **Equation**:
- **Ã = A_II** (transformed sensitive attributes).
- **Purpose**: Generates "fair" data (Ã) by permuting sensitive attributes to decouple them from the target variable Y.
### 4. **Predictor (f)**
- **Input**: (X, Y).
- **Output**: Predicted value **Ŷ**.
- **Role**: Standard predictive model (e.g., regression, classification).
### 5. **Discriminator (D)**
- **Function**: Tests fairness of predictions.
- **Equation**:
- **D(Ŷ, Ã, Y) = (Ŷ ⊥ Ã | Y)?** (tests independence between predictions and transformed attributes given Y).
- **Validation**:
- **Fair data**: Satisfies **Ŷ ⊥ à | Y** (predictions are independent of à given Y).
- **Original data**: May violate fairness (denoted by red text: **Ŷ ⊥ A | Y (approx.)**).
---
## Textual Elements in Diagram
1. **Labels**:
- "Sensitive Attributes" (top-left).
- "Input Data" (center-left).
- "Predictor" (center).
- "Prediction" (top-right).
- "Discriminator" (bottom-right).
2. **Equations**:
- **Ã = A_II** (inverse conditional permutation).
- **D(Ŷ, Ã, Y) = (Ŷ ⊥ Ã | Y)?** (fairness condition).
3. **Annotations**:
- "Fair data" (blue text) vs. "Original data" (red text).
---
## Spatial Grounding & Component Isolation
- **Regions**:
1. **Header**: Sensitive Attributes (Ethnicity, Sex, Financial Status).
2. **Main Chart**:
- Input Data (A, X, Y) → Inverse Conditional Permutation (Ã) → Predictor (f) → Prediction (Ŷ).
- Discriminator (D) validates fairness.
3. **Footer**: None explicitly labeled.
---
## Critical Observations
1. **Fairness Mechanism**: The system uses inverse conditional permutation (Ã = A_II) to decouple sensitive attributes from predictions.
2. **Validation**: The discriminator checks if predictions (Ŷ) are statistically independent of transformed attributes (Ã) given Y.
3. **Bias Mitigation**: The goal is to ensure **Ŷ ⊥ Ã | Y** (predictions are fair) rather than relying on original biased data (**Ŷ ⊥ A | Y**).
---
## Limitations
- No numerical data or trends (e.g., heatmaps, line charts) are present.
- The diagram focuses on **conceptual workflow** rather than empirical results.
---
## Conclusion
This diagram outlines a **bias mitigation framework** for predictive models, emphasizing fairness through attribute transformation and statistical validation. The absence of numerical data suggests it is a **conceptual blueprint** rather than an empirical analysis.