## Line Graph: PCI Value Trends Over Time
### Overview
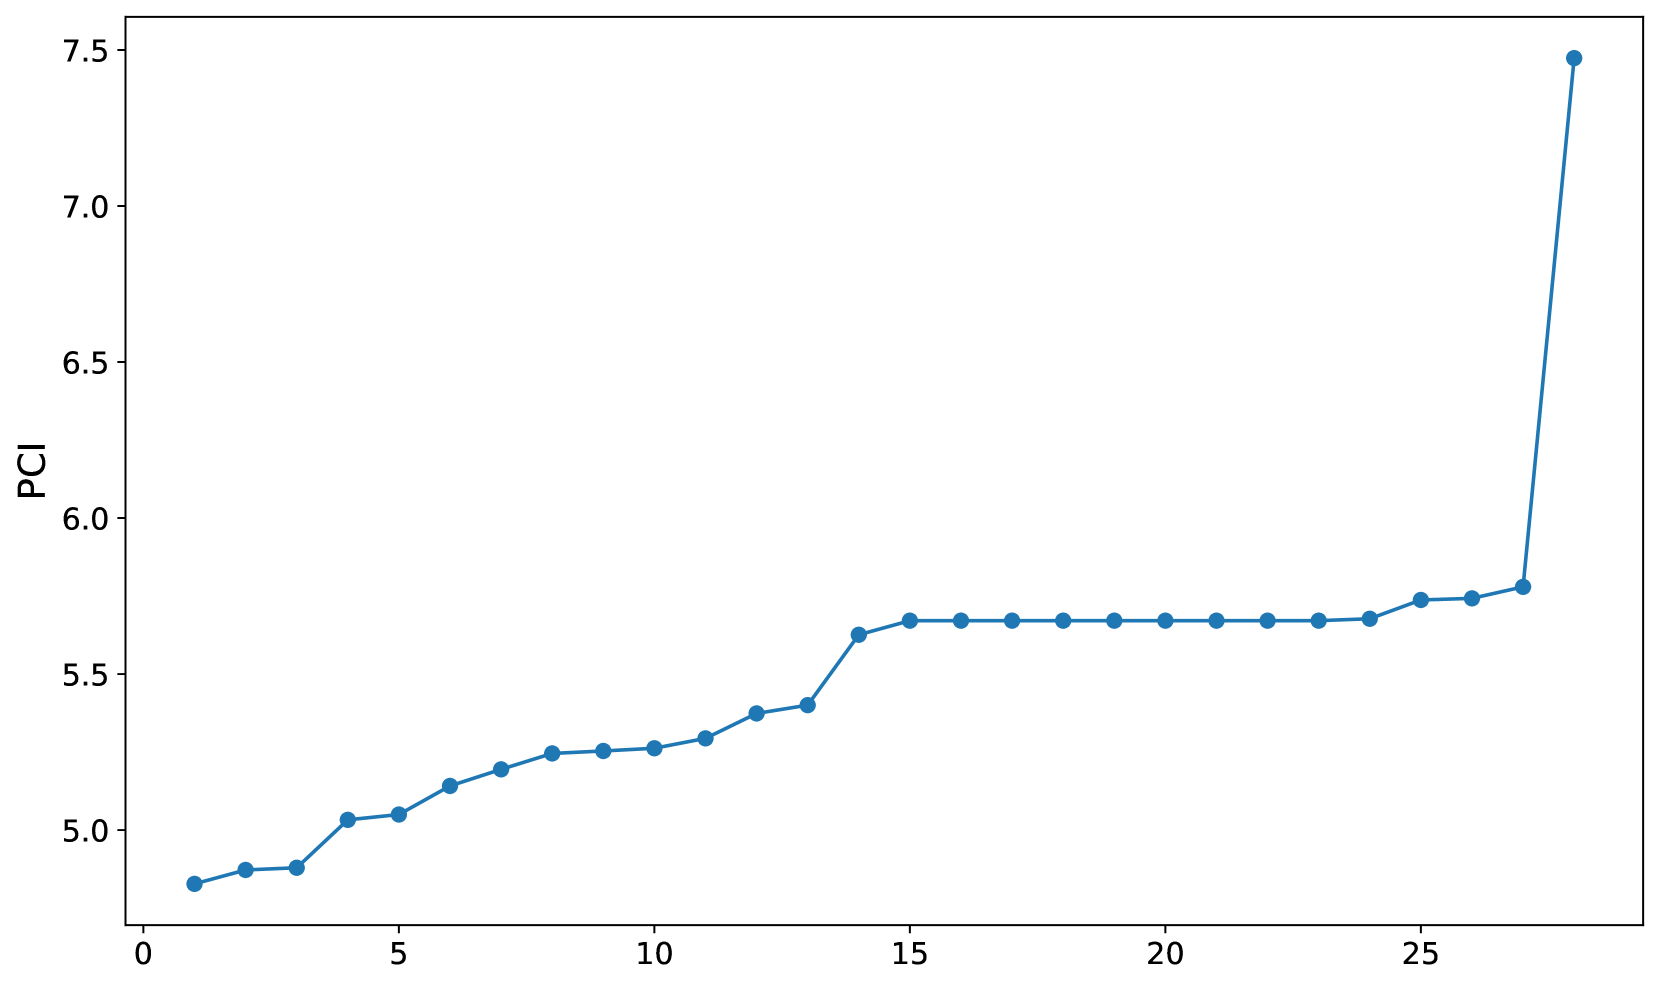
The image depicts a line graph illustrating the progression of a metric labeled "PCI" (Performance Component Index?) over a numerical range from 0 to 28 on the x-axis. The y-axis represents PCI values ranging from 4.5 to 7.5. The line exhibits a gradual upward trend with a sharp vertical spike at the final data point.
### Components/Axes
- **X-axis**: Labeled with numerical increments from 0 to 28 (no explicit label provided).
- **Y-axis**: Explicitly labeled "PCI" with values ranging from 4.5 to 7.5 in 0.5 increments.
- **Line**: A single blue line with circular markers at each data point. No legend or additional data series present.
### Detailed Analysis
1. **Initial Phase (x=0 to x=12)**:
- The line begins at approximately **4.8** (x=0) and increases gradually to **5.4** by x=12.
- Notable: Small fluctuations between x=0–5 (e.g., 4.8 → 4.9 → 5.0 → 5.1 → 5.2 → 5.3).
2. **Mid-Phase (x=12 to x=25)**:
- The line stabilizes between **5.4** and **5.7** from x=12 to x=25.
- Minor fluctuations observed (e.g., 5.4 → 5.5 → 5.6 → 5.7).
3. **Final Spike (x=25 to x=28)**:
- At x=28, the line abruptly rises from **5.7** to **7.5**, creating a vertical spike.
### Key Observations
- **Gradual Increase**: The metric shows steady growth until x=25, with no significant deviations.
- **Sudden Spike**: The final data point (x=28) exhibits an anomalous jump of **1.8 units**, far exceeding the prior trend.
- **No Outliers**: All data points align with the line except the final spike, which suggests a potential threshold breach or system failure.
### Interpretation
The graph likely represents a system or process metric (e.g., performance, efficiency, or stability) that remained stable until a critical event triggered a sharp deterioration. The abrupt spike at x=28 could indicate:
1. A **threshold breach** (e.g., system overload, failure, or maximum capacity reached).
2. A **data collection anomaly** (e.g., sensor malfunction or abrupt external intervention).
3. A **step-change event** (e.g., policy shift, resource reallocation, or environmental disruption).
The absence of a legend or contextual labels limits definitive interpretation, but the pattern strongly suggests a transition from stability to instability. Further investigation into the system’s operational parameters at x=28 is warranted to identify the root cause of the spike.