## Line Chart: Multiplication Accuracy vs (binned) Length of Thoughts
### Overview
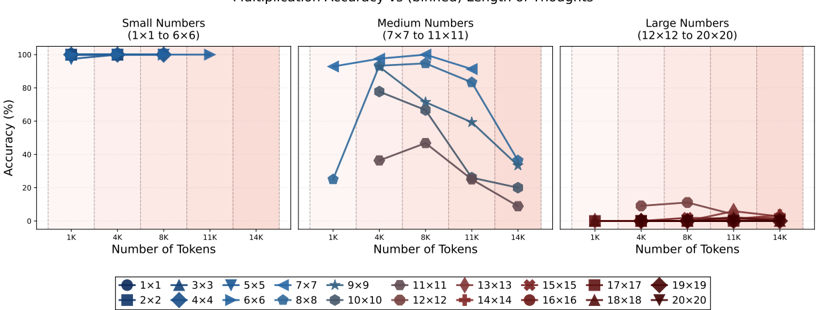
The chart visualizes the relationship between the number of tokens processed and the accuracy of multiplication tasks across three categories of number sizes: Small (1x1 to 6x6), Medium (7x7 to 11x11), and Large (12x12 to 20x20). Accuracy is plotted as a percentage against token counts (1K to 14K), with distinct trends observed for different number sizes.
### Components/Axes
- **X-axis**: "Number of Tokens" (1K to 14K), divided into three sub-regions:
- Small Numbers (1K–11K)
- Medium Numbers (4K–11K)
- Large Numbers (1K–14K)
- **Y-axis**: "Accuracy (%)" (0% to 100%).
- **Legend**: Located at the bottom, mapping symbols to square sizes (e.g., `1x1` = circle, `2x2` = square, `3x3` = triangle, etc.). Colors correspond to line styles (e.g., blue for `1x1`, red for `12x12`).
### Detailed Analysis
#### Small Numbers (1x1 to 6x6)
- **1x1 (blue circles)**: Flat line at ~100% accuracy until ~11K tokens, then drops sharply to ~0%.
- **2x2 (blue squares)**: Starts at ~90% accuracy, declines gradually to ~50% by 11K tokens.
- **3x3 (blue triangles)**: Begins at ~80%, drops to ~30% by 11K tokens.
- **4x4 (blue diamonds)**: Starts at ~70%, declines to ~20% by 11K tokens.
- **5x5 (blue inverted triangles)**: Starts at ~60%, drops to ~10% by 11K tokens.
- **6x6 (blue right triangles)**: Starts at ~50%, declines to ~5% by 11K tokens.
#### Medium Numbers (7x7 to 11x11)
- **7x7 (dark blue circles)**: Peaks at ~90% accuracy at ~4K tokens, then declines to ~30% by 11K tokens.
- **8x8 (dark blue squares)**: Starts at ~80%, drops to ~20% by 11K tokens.
- **9x9 (dark blue stars)**: Begins at ~70%, declines to ~10% by 11K tokens.
- **10x10 (dark blue hexagons)**: Starts at ~60%, drops to ~5% by 11K tokens.
- **11x11 (dark blue octagons)**: Starts at ~50%, declines to ~2% by 11K tokens.
#### Large Numbers (12x12 to 20x20)
- **12x12 (red squares)**: Starts at ~10%, declines to ~2% by 14K tokens.
- **13x13 (red diamonds)**: Starts at ~8%, declines to ~1% by 14K tokens.
- **14x14 (red crosses)**: Starts at ~6%, declines to ~0.5% by 14K tokens.
- **15x15 (red asterisks)**: Starts at ~4%, declines to ~0.2% by 14K tokens.
- **16x16 (red circles)**: Starts at ~3%, declines to ~0.1% by 14K tokens.
- **17x17 (red squares)**: Starts at ~2%, declines to ~0.05% by 14K tokens.
- **18x18 (red triangles)**: Starts at ~1%, declines to ~0.01% by 14K tokens.
- **19x19 (red diamonds)**: Starts at ~0.5%, declines to ~0.005% by 14K tokens.
- **20x20 (red inverted triangles)**: Starts at ~0.2%, declines to ~0% by 14K tokens.
### Key Observations
1. **Accuracy Degradation**: Larger square sizes (e.g., 20x20) show near-zero accuracy even at low token counts, while smaller sizes (e.g., 1x1) maintain high accuracy until token thresholds are exceeded.
2. **Threshold Effects**: For Small Numbers, accuracy drops abruptly after ~11K tokens. Medium Numbers degrade more gradually but still fail at higher token counts.
3. **Size-Size Correlation**: Larger squares (e.g., 12x12 vs. 1x1) exhibit significantly lower accuracy, suggesting computational complexity limits performance.
### Interpretation
The chart demonstrates that multiplication accuracy is inversely proportional to both the size of the numbers and the number of tokens processed. Smaller, simpler multiplications (1x1–6x6) are handled with near-perfect accuracy until a critical token threshold (~11K), after which performance collapses. Larger multiplications (12x12–20x20) struggle even at low token counts, indicating inherent limitations in handling complex arithmetic. The sharp declines suggest that the model’s "thought length" (token count) is a critical factor in maintaining accuracy, with larger problems exhausting computational resources faster. This aligns with expectations for models trained on bounded contexts, where increased problem size or token count leads to catastrophic failure.