## Chart: Local Learning Coefficient vs. Iteration for Different Batch Sizes
### Overview
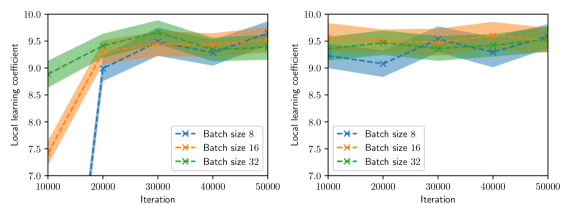
The image contains two line charts comparing the local learning coefficient against the iteration number for three different batch sizes (8, 16, and 32). The charts show the performance of each batch size over iterations, with shaded regions indicating variability or confidence intervals. The chart on the left shows the performance starting at iteration 10000, while the chart on the right shows the performance starting at iteration 0.
### Components/Axes
* **X-axis (Iteration):**
* Ranges from 10000 to 50000 in both charts.
* Markers at 10000, 20000, 30000, 40000, and 50000.
* **Y-axis (Local learning coefficient):**
* Ranges from 7.0 to 10.0 in both charts.
* Markers at 7.0, 7.5, 8.0, 8.5, 9.0, 9.5, and 10.0.
* **Legend (bottom):**
* Batch size 8 (blue line with 'x' markers)
* Batch size 16 (orange line with 'x' markers)
* Batch size 32 (green line with 'x' markers)
### Detailed Analysis
**Left Chart:**
* **Batch size 8 (blue):**
* Starts at approximately 7.0 at iteration 10000.
* Increases sharply to approximately 9.0 at iteration 20000.
* Fluctuates between 9.0 and 9.5 from iteration 20000 to 50000.
* **Batch size 16 (orange):**
* Starts at approximately 7.5 at iteration 10000.
* Increases to approximately 9.0 at iteration 20000.
* Reaches approximately 9.5 at iteration 30000.
* Fluctuates between 9.2 and 9.7 from iteration 30000 to 50000.
* **Batch size 32 (green):**
* Starts at approximately 9.0 at iteration 10000.
* Increases to approximately 9.5 at iteration 20000.
* Reaches approximately 9.7 at iteration 30000.
* Fluctuates between 9.3 and 9.7 from iteration 30000 to 50000.
**Right Chart:**
* **Batch size 8 (blue):**
* Starts at approximately 9.0 at iteration 10000.
* Fluctuates between 9.0 and 9.5 from iteration 10000 to 50000.
* **Batch size 16 (orange):**
* Starts at approximately 9.5 at iteration 10000.
* Fluctuates between 9.3 and 9.8 from iteration 10000 to 50000.
* **Batch size 32 (green):**
* Starts at approximately 9.5 at iteration 10000.
* Fluctuates between 9.3 and 9.7 from iteration 10000 to 50000.
### Key Observations
* In the left chart, batch sizes 16 and 32 start with lower local learning coefficients but quickly catch up to batch size 8.
* In the left chart, batch size 8 has a sharp increase in local learning coefficient between iterations 10000 and 20000.
* In the right chart, all batch sizes start with relatively high local learning coefficients.
* The shaded regions around each line indicate the variability or confidence interval for each batch size.
* The right chart shows the performance starting at iteration 0, while the left chart shows the performance starting at iteration 10000.
### Interpretation
The charts compare the performance of different batch sizes in terms of local learning coefficient over iterations. The left chart suggests that smaller batch sizes (8 and 16) initially have lower local learning coefficients but improve significantly over the first 20000 iterations. The right chart shows that when starting from iteration 0, all batch sizes have relatively high local learning coefficients. This suggests that the initial iterations are crucial for the smaller batch sizes to catch up in performance. The shaded regions indicate the variability in performance, which is relatively consistent across all batch sizes. Overall, the choice of batch size can impact the initial learning rate, but all batch sizes converge to similar performance levels after a certain number of iterations.