\n
## Line Chart: Local Learning Coefficient vs. Iteration for Different Batch Sizes
### Overview
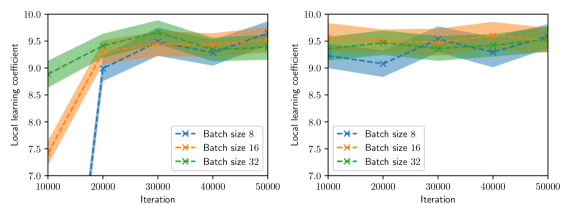
The image presents two line charts displaying the relationship between the local learning coefficient and the iteration number for three different batch sizes (8, 16, and 32). Both charts share the same axes and legend, suggesting a comparison of the learning coefficient behavior across batch sizes. The charts appear to represent two different experimental runs or conditions.
### Components/Axes
* **X-axis:** Iteration, ranging from approximately 10,000 to 50,000.
* **Y-axis:** Local learning coefficient, ranging from approximately 7.0 to 10.0.
* **Legend:** Located in the bottom-right corner of the right chart.
* Batch size 8 (Blue, dashed line with 'x' markers)
* Batch size 16 (Orange, dashed-dotted line with '+' markers)
* Batch size 32 (Green, solid line with '^' markers)
* **Chart 1:** Left side of the image.
* **Chart 2:** Right side of the image.
### Detailed Analysis or Content Details
**Chart 1 (Left):**
* **Batch Size 8 (Blue):** Starts at approximately 8.0 at iteration 10,000, rapidly increases to around 9.2 by iteration 15,000, then fluctuates between approximately 9.0 and 9.5 until iteration 50,000.
* **Batch Size 16 (Orange):** Begins at approximately 7.5 at iteration 10,000, increases steadily to around 9.4 by iteration 30,000, and then plateaus around 9.5 until iteration 50,000.
* **Batch Size 32 (Green):** Starts at approximately 9.0 at iteration 10,000, increases to around 9.6 by iteration 25,000, and then fluctuates between approximately 9.5 and 9.8 until iteration 50,000.
**Chart 2 (Right):**
* **Batch Size 8 (Blue):** Remains relatively stable around 9.2-9.4 from iteration 10,000 to 50,000, with minor fluctuations.
* **Batch Size 16 (Orange):** Starts at approximately 9.2 at iteration 10,000, increases to around 9.6 by iteration 20,000, and then fluctuates between approximately 9.5 and 9.8 until iteration 50,000.
* **Batch Size 32 (Green):** Begins at approximately 9.5 at iteration 10,000, remains relatively stable around 9.6-9.8 from iteration 10,000 to 50,000, with minor fluctuations.
### Key Observations
* **Chart 1:** Batch size 8 exhibits a significant initial increase in the local learning coefficient, followed by stabilization. Batch sizes 16 and 32 show a more gradual increase and higher overall values.
* **Chart 2:** All batch sizes demonstrate relatively stable local learning coefficients throughout the iterations. Batch size 32 consistently maintains the highest values.
* The behavior of Batch size 8 differs significantly between the two charts. In Chart 1, it shows a large initial jump, while in Chart 2, it remains stable.
### Interpretation
The charts likely represent the training process of a machine learning model, where the local learning coefficient is a parameter adjusted during optimization. The batch size influences the stability and speed of learning.
* **Chart 1** suggests that a smaller batch size (8) might lead to faster initial learning but potentially more instability, as indicated by the fluctuations. Larger batch sizes (16 and 32) demonstrate more stable learning, albeit potentially slower.
* **Chart 2** indicates that under different conditions (or a different experimental run), even the smallest batch size (8) can achieve stable learning. The larger batch sizes continue to show stable and relatively high learning coefficients.
* The discrepancy between the two charts for batch size 8 is a notable outlier. This could be due to variations in the initial conditions, the data used for training, or the specific optimization algorithm employed. It highlights the sensitivity of the learning process to these factors.
The data suggests that the optimal batch size depends on the specific training scenario. While larger batch sizes generally promote stability, smaller batch sizes might be beneficial in certain cases, particularly if the initial learning phase requires rapid adaptation. Further investigation is needed to understand the reasons behind the differing behavior of batch size 8 in the two charts.