## Line Graphs: Local Learning Coefficient vs. Iteration Across Batch Sizes
### Overview
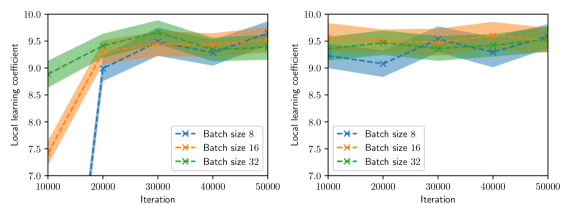
The image contains two side-by-side line graphs comparing the evolution of a "Local Learning Coefficient" across 50,000 iterations for three batch sizes (8, 16, 32). Both graphs use shaded regions to represent confidence intervals, with distinct line styles and markers for each batch size. The left graph shows more pronounced volatility, while the right graph exhibits smoother trends.
### Components/Axes
- **X-axis (Horizontal)**: Iteration count (10,000 to 50,000 in increments of 10,000).
- **Y-axis (Vertical)**: Local Learning Coefficient (7.0 to 10.0 in increments of 0.5).
- **Legends**:
- **Left Graph**:
- Blue "x" markers: Batch size 8
- Orange "x" markers: Batch size 16
- Green "x" markers: Batch size 32
- **Right Graph**:
- Same color/marker scheme as left graph.
- **Shaded Regions**: Confidence intervals (darker for lower bounds, lighter for upper bounds).
### Detailed Analysis
#### Left Graph (Volatile Trends)
1. **Batch Size 8 (Blue)**:
- Starts at ~7.5 (iteration 10k), drops sharply to ~7.0 by 20k, then rises to ~9.5 by 30k.
- Fluctuates between ~8.5 and ~9.5 after 30k.
2. **Batch Size 16 (Orange)**:
- Begins at ~8.5 (10k), dips to ~8.0 by 20k, then stabilizes near ~9.0.
- Shows minor oscillations between ~8.8 and ~9.2.
3. **Batch Size 32 (Green)**:
- Starts at ~9.0 (10k), peaks at ~9.5 by 20k, then fluctuates between ~8.8 and ~9.3.
- Ends near ~9.2 at 50k.
#### Right Graph (Stable Trends)
1. **Batch Size 8 (Blue)**:
- Begins at ~9.0 (10k), dips to ~8.5 by 20k, then stabilizes near ~9.0.
- Minor fluctuations between ~8.8 and ~9.2.
2. **Batch Size 16 (Orange)**:
- Starts at ~9.0 (10k), rises slightly to ~9.2 by 20k, then stabilizes near ~9.1.
- Fluctuates between ~8.9 and ~9.3.
3. **Batch Size 32 (Green)**:
- Begins at ~9.0 (10k), peaks at ~9.2 by 20k, then stabilizes near ~9.1.
- Fluctuates between ~8.9 and ~9.3.
### Key Observations
1. **Initial Volatility**: Smaller batch sizes (8) exhibit sharper initial drops in the left graph, suggesting sensitivity to early iterations.
2. **Stability**: Larger batches (32) show smoother trends in both graphs, indicating reduced sensitivity to iteration changes.
3. **Confidence Intervals**: Wider shaded regions in the left graph (e.g., Batch 8’s initial drop) imply higher uncertainty in smaller batches.
4. **Convergence**: By 50k iterations, all batch sizes in the right graph cluster tightly around ~9.0–9.2, suggesting eventual stability.
### Interpretation
- **Batch Size Impact**: Smaller batches (8) demonstrate higher variability in learning coefficients, potentially due to noisier gradient estimates. Larger batches (32) provide more stable updates, aligning with theoretical expectations of reduced variance in stochastic gradient descent.
- **Confidence Intervals**: The shaded regions confirm that smaller batches have less reliable measurements, as seen in the left graph’s wider intervals during rapid changes.
- **Practical Implications**: While smaller batches may recover performance faster (e.g., Batch 8’s sharp rise in the left graph), larger batches offer more predictable training dynamics, which could be critical for applications requiring consistent updates.
*Note: All values are approximate, derived from visual inspection of the graphs. Uncertainty is reflected in the shaded confidence intervals.*