## Diagram: Data Structure Visualization
### Overview
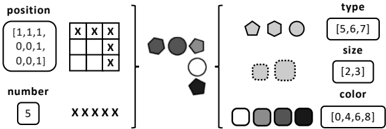
The image is a technical diagram illustrating a data structure or mapping system. It is divided into three distinct sections arranged horizontally, each enclosed in square brackets. The diagram visually connects positional data (left) to a set of graphical objects (center) and their defined attributes (right). The overall purpose appears to be demonstrating how abstract data (coordinates, counts) translates to visual properties (shape, size, color) of objects in a set.
### Components/Axes
The diagram consists of three primary components:
1. **Left Section (Position & Number):**
* **Label:** `position`
* **Content:** A 3x3 grid. The top row has an 'X' in all three cells. The middle and bottom rows have an 'X' only in the rightmost cell.
* **Associated Data:** Below the grid, the text `number` is followed by the numeral `5` and a row of five 'X' marks (`XXXXX`).
* **Spatial Grounding:** This section is located on the far left of the image.
2. **Center Section (Graphical Objects):**
* **Content:** A cluster of six geometric shapes.
* Three pentagons: one filled dark gray, one filled medium gray, one with a black outline and white fill.
* Two circles: one filled medium gray, one with a black outline and white fill.
* One hexagon: filled dark gray.
* **Spatial Grounding:** This cluster is centrally located, between the left and right bracketed sections.
3. **Right Section (Attribute Legend):**
* **Content:** Three labeled lists defining attributes for the objects.
* `type`: `[5,6,7]`
* `size`: `[2,3]`
* `color`: `[0,4,6,8]`
* **Spatial Grounding:** This legend is positioned on the far right of the image.
### Detailed Analysis
* **Positional Data:** The 3x3 grid represents a coordinate system. The 'X' marks indicate occupied or active cells. The pattern shows all cells in the first row (positions (1,1), (1,2), (1,3)) and the rightmost cells of the second and third rows (positions (2,3) and (3,3)) are marked. The total count of marks is 5, which is explicitly confirmed by the `number` field.
* **Object Attributes (Inferred from Legend and Visuals):**
* **Type:** The list `[5,6,7]` likely corresponds to the number of sides of the polygons. Visually, there are pentagons (5 sides) and a hexagon (6 sides). The circles may represent a type `7` in this schema, or the list may be incomplete for the shown objects.
* **Size:** The list `[2,3]` suggests two discrete size categories. Visually, some shapes (e.g., the dark pentagon) appear larger than others (e.g., the outlined pentagon), consistent with a `size` value of 3 vs. 2.
* **Color:** The list `[0,4,6,8]` appears to map to a grayscale palette. Visually, `0` likely corresponds to white (outlined shapes), `4` to light/medium gray, `6` to dark gray, and `8` to black (outlines and some fills).
* **Cross-Reference:** The diagram implies a relationship where the 5 objects in the center correspond to the 5 marked positions on the left. Each object possesses a specific combination of type, size, and color as defined by the ranges in the right-hand legend.
### Key Observations
1. **Discrete Attribute Sets:** The attributes (`type`, `size`, `color`) are defined as discrete lists of integers, not continuous ranges. This suggests a categorical or indexed data model.
2. **Visual Encoding:** The diagram explicitly encodes data into visual variables: shape (type), scale (size), and fill/outline (color).
3. **Asymmetric Mapping:** The positional grid is not fully populated (5 of 9 cells), and the number of object types (3 listed) does not perfectly match the variety of shapes shown (pentagon, hexagon, circle), indicating potential complexity or a specific subset of data being visualized.
4. **Spatial Separation:** The clear separation of raw data (left), visual representation (center), and schema/legend (right) follows a logical flow for technical documentation.
### Interpretation
This diagram serves as a visual key or schema for a data visualization system. It demonstrates how a sparse matrix of positional data (the 3x3 grid) is associated with a set of graphical markers. Each marker is not generic but is defined by a multi-dimensional attribute vector (`type`, `size`, `color`).
The data suggests a system where objects are placed on a grid, and their visual representation is determined by a set of predefined, discrete properties. This is common in fields like:
* **Computer Graphics/Game Development:** For sprite sheets or tile maps where objects have properties.
* **Data Visualization:** For defining the visual grammar of a complex chart (e.g., a scatter plot where point shape, size, and color encode different data dimensions).
* **UI/UX Design:** For illustrating a design system's component library with variants.
The notable "outlier" is the inclusion of circles in the visual set when the `type` legend only lists numbers typically associated with polygons (`5,6,7`). This could imply that `7` is assigned to circles in this specific schema, or that the diagram is showing a sample where not all listed types are used. The primary relationship is the translation of abstract, discrete data into a concrete visual form, providing a blueprint for consistent representation.