## Diagram: Multi-Attribute Data Representation
### Overview
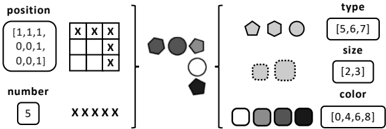
The image presents a structured visualization of data categorized into three primary sections: **position**, **number**, and **type**. Each section contains distinct elements with labeled attributes, legends, and spatial relationships. The diagram combines grid-based positioning, numerical counts, and categorical shapes with embedded metadata.
---
### Components/Axes
#### Position Section
- **Grid Layout**: A 3x3 grid with cells marked by "X" symbols.
- **Coordinates**:
- `[1,1,1]` (top-left cell)
- `[0,0,1]` (middle-right cell)
- `[0,0,1]` (bottom-right cell)
- **Ambiguity**: The third value in coordinates (e.g., `[1,1,1]`) is unclear in a 2D grid context. Likely a typo or placeholder.
#### Number Section
- **Label**: "number"
- **Value**: A box containing the integer `5`.
- **Visualization**: Five "X" symbols aligned horizontally below the number.
#### Type Section
- **Shapes**:
- Pentagon (solid)
- Hexagon (solid)
- Circle (solid)
- Square (dotted)
- **Attributes**:
- **Type**: `[5,6,7]` (labels for pentagon, hexagon, circle)
- **Size**: `[2,3]` (labels for square sizes)
- **Color**: `[0,4,6,8]` (labels for color codes)
- **Legend**:
- Colors: White (`0`), Gray (`4`), Darker Gray (`6`), Black (`8`).
- Sizes: Solid (`2`), Dotted (`3`).
---
### Detailed Analysis
#### Position Grid
- **X Placement**:
- Top-left cell (`[1,1,1]`).
- Middle-right and bottom-right cells (`[0,0,1]`).
- The repeated `[0,0,1]` suggests a possible error or intentional overlap.
#### Number Section
- **Count**: The number `5` directly corresponds to five "X" symbols, confirming a 1:1 relationship.
#### Type Section
- **Shape Attributes**:
- **Pentagon/Hexagon/Circle**: Solid fill, sizes `2` (per legend).
- **Square**: Dotted pattern, size `3` (per legend).
- **Color Mapping**:
- Pentagon: White (`0`).
- Hexagon: Gray (`4`).
- Circle: Darker Gray (`6`).
- Square: Black (`8`).
---
### Key Observations
1. **Grid Inconsistency**: The coordinate `[0,0,1]` appears twice, potentially indicating a duplicate or mislabeled cell.
2. **Shape-Size Relationship**: The square is the only shape with a dotted pattern and size `3`, while others use size `2`.
3. **Color Codes**: The legend’s color codes (`0,4,6,8`) align with the shapes’ visual hierarchy (lightest to darkest).
---
### Interpretation
- **Position Data**: The grid likely represents a 3D spatial dataset, though the third coordinate is ambiguous. The "X" marks may denote critical points or outliers.
- **Number Section**: The count `5` suggests a total of five data instances, possibly linked to the grid’s "X" markers.
- **Type Section**: Shapes with varying attributes (size, color, pattern) could represent categorical data. For example:
- **Type `[5,6,7]`**: Geometric shapes as categories.
- **Size `[2,3]`**: Size differentiation (e.g., small vs. large).
- **Color `[0,4,6,8]`**: Intensity or grouping (e.g., light to dark).
- **Legend Consistency**: Colors and sizes in the legend match the shapes’ visual properties, confirming accurate encoding.
---
### Conclusion
This diagram integrates spatial, numerical, and categorical data into a cohesive framework. The position grid and number section provide foundational counts, while the type section introduces multidimensional attributes (size, color, pattern). The legend ensures clarity in interpreting these attributes, though ambiguities in coordinates and shape categorization warrant further clarification.