## Stacked Bar Chart: Number of Solved Tasks by Level
### Overview
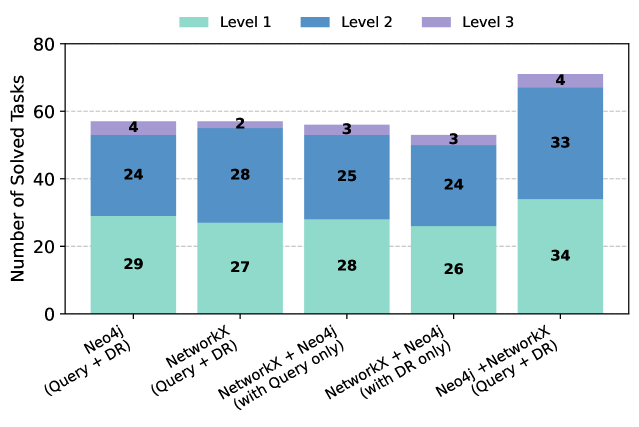
The image is a stacked bar chart comparing the number of solved tasks across different configurations of Neo4j and NetworkX, categorized by task difficulty levels (Level 1, Level 2, and Level 3). The y-axis represents the number of solved tasks, ranging from 0 to 80. The x-axis represents different configurations of Neo4j and NetworkX, such as using Query and DR (Data Reduction) or using Query only or DR only.
### Components/Axes
* **Y-axis:** "Number of Solved Tasks", ranging from 0 to 80 in increments of 20.
* **X-axis:** Categorical axis representing different configurations of Neo4j and NetworkX:
* Neo4j (Query + DR)
* NetworkX (Query + DR)
* NetworkX + Neo4j (with Query only)
* NetworkX + Neo4j (with DR only)
* Neo4j + NetworkX (Query + DR)
* **Legend:** Located at the top of the chart.
* Level 1: Light teal color
* Level 2: Blue color
* Level 3: Light purple color
### Detailed Analysis
The chart presents the number of solved tasks for each configuration, broken down by difficulty level.
* **Neo4j (Query + DR):**
* Level 1: 29
* Level 2: 24
* Level 3: 4
* **NetworkX (Query + DR):**
* Level 1: 27
* Level 2: 28
* Level 3: 2
* **NetworkX + Neo4j (with Query only):**
* Level 1: 28
* Level 2: 25
* Level 3: 3
* **NetworkX + Neo4j (with DR only):**
* Level 1: 26
* Level 2: 24
* Level 3: 3
* **Neo4j + NetworkX (Query + DR):**
* Level 1: 34
* Level 2: 33
* Level 3: 4
### Key Observations
* The "Neo4j + NetworkX (Query + DR)" configuration has the highest number of solved tasks overall.
* Level 1 tasks are generally the most solved across all configurations.
* Level 3 tasks are the least solved across all configurations.
* The "NetworkX (Query + DR)" configuration has the lowest number of solved Level 3 tasks (2).
### Interpretation
The chart compares the performance of different configurations of Neo4j and NetworkX in solving tasks of varying difficulty levels. The "Neo4j + NetworkX (Query + DR)" configuration appears to be the most effective, solving the highest number of tasks overall. The distribution of solved tasks across difficulty levels suggests that Level 1 tasks are the easiest, while Level 3 tasks are the most challenging for all configurations. The data suggests that combining Neo4j and NetworkX with both Query and DR leads to better performance in solving tasks.