\n
## Stacked Bar Chart: Task Solving Performance Comparison
### Overview
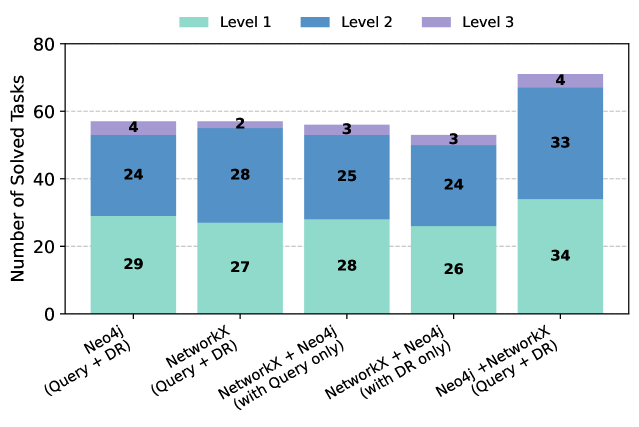
This image presents a stacked bar chart comparing the number of solved tasks across different combinations of technologies: Neo4j, NetworkX, and their respective approaches (Query + DR, Query only, DR only). The chart categorizes the solved tasks into three levels (Level 1, Level 2, and Level 3).
### Components/Axes
* **X-axis:** Represents the different technology combinations:
* Neo4j (Query + DR)
* NetworkX (Query + DR)
* NetworkX + Neo4j (with Query only)
* NetworkX + Neo4j (with DR only)
* Neo4j + NetworkX (Query + DR)
* **Y-axis:** Represents the "Number of Solved Tasks", ranging from 0 to 80.
* **Legend:** Located at the top-left corner, defines the color coding for the task levels:
* Level 1: Light Green (#90EE90)
* Level 2: Blue (#6495ED)
* Level 3: Purple (#A020F0)
### Detailed Analysis
The chart consists of five stacked bars, one for each technology combination. The height of each bar represents the total number of solved tasks. Each bar is divided into three colored segments representing the number of tasks solved at each level.
* **Neo4j (Query + DR):**
* Level 1: Approximately 29 tasks
* Level 2: Approximately 24 tasks
* Level 3: Approximately 4 tasks
* Total: Approximately 57 tasks
* **NetworkX (Query + DR):**
* Level 1: Approximately 27 tasks
* Level 2: Approximately 28 tasks
* Level 3: Approximately 2 tasks
* Total: Approximately 57 tasks
* **NetworkX + Neo4j (with Query only):**
* Level 1: Approximately 28 tasks
* Level 2: Approximately 25 tasks
* Level 3: Approximately 3 tasks
* Total: Approximately 56 tasks
* **NetworkX + Neo4j (with DR only):**
* Level 1: Approximately 26 tasks
* Level 2: Approximately 24 tasks
* Level 3: Approximately 3 tasks
* Total: Approximately 53 tasks
* **Neo4j + NetworkX (Query + DR):**
* Level 1: Approximately 34 tasks
* Level 2: Approximately 33 tasks
* Level 3: Approximately 4 tasks
* Total: Approximately 71 tasks
### Key Observations
* The "Neo4j + NetworkX (Query + DR)" combination consistently outperforms all other combinations in terms of the total number of solved tasks.
* The "NetworkX + Neo4j (with DR only)" combination has the lowest total number of solved tasks.
* Level 1 tasks are generally solved more frequently than Level 2 and Level 3 tasks across all combinations.
* The difference in performance between "Neo4j (Query + DR)" and "NetworkX (Query + DR)" is minimal.
### Interpretation
The data suggests that combining Neo4j and NetworkX with both Query and DR (Data Retrieval) approaches yields the best results in solving tasks, significantly outperforming other combinations. This indicates a synergistic effect when both technologies are utilized together with both Query and DR methods. The consistent dominance of Level 1 tasks suggests that the task difficulty plays a role, with simpler tasks being solved more readily. The lower performance of the "NetworkX + Neo4j (with DR only)" combination suggests that the Query component is crucial for effective task solving in this context. The chart provides a clear comparison of the effectiveness of different technology combinations and approaches for task solving, highlighting the benefits of a combined strategy.