## Line Chart: Risk-Coverage Curve (Dialect Task)
### Overview
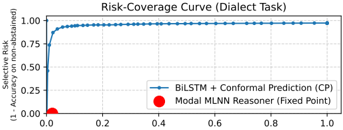
This image displays a "Risk-Coverage Curve" for a "Dialect Task." It compares the performance of two distinct machine learning approaches: a "BiLSTM + Conformal Prediction (CP)" model, represented by a continuous blue line with diamond markers, and a "Modal MLNN Reasoner (Fixed Point)," represented by a single red circular marker. The chart illustrates the trade-off between the coverage of the model (the proportion of data points the model is allowed to predict on) and the selective risk (1 minus the accuracy on those non-abstained predictions).
### Components/Axes
* **Title:** "Risk-Coverage Curve (Dialect Task)" centered at the top.
* **Y-Axis:** Labeled "Selective Risk (1 - Accuracy on non-abstained)". The scale ranges from 0.00 to 1.00 in increments of 0.25.
* **X-Axis:** Unlabeled, but implied to represent "Coverage" (the proportion of the dataset predicted). The scale ranges from 0.0 to 1.0 in increments of 0.2.
* **Legend:** Located in the bottom-right quadrant of the chart area.
* **Blue Line with Diamond Markers:** Labeled "BiLSTM + Conformal Prediction (CP)".
* **Red Circle Marker:** Labeled "Modal MLNN Reasoner (Fixed Point)".
* **Grid:** Light gray dashed grid lines are present throughout the plot area.
### Detailed Analysis
* **BiLSTM + Conformal Prediction (CP) Trend:**
* The curve originates at the origin (0,0).
* It exhibits a very sharp, near-vertical upward slope between X=0.0 and X=0.05. By X=0.05, the Selective Risk has already climbed to approximately 0.85–0.90.
* After X=0.1, the curve flattens significantly, showing a very gradual, slight upward trend as it approaches X=1.0.
* At X=1.0, the Selective Risk is approximately 0.95–0.98.
* **Modal MLNN Reasoner (Fixed Point) Data Point:**
* This is a single data point located in the bottom-left region of the chart.
* **Coordinates:** The X-value is approximately 0.03–0.04. The Y-value is approximately 0.02–0.03.
### Key Observations
* **Performance Disparity:** The "Modal MLNN Reasoner" significantly outperforms the "BiLSTM + CP" model in this specific metric. At a very low coverage (approx. 0.03), the MLNN Reasoner achieves a very low risk (approx. 0.02), whereas the BiLSTM model at a similar coverage level (approx. 0.03) has a much higher risk (approx. 0.75).
* **Model Behavior:** The BiLSTM + CP curve suggests that as the model is forced to cover more of the dataset (moving right on the X-axis), its risk increases rapidly and remains high, indicating poor performance when forced to make predictions on the entire dataset.
* **Fixed Point Nature:** The "Modal MLNN Reasoner" is plotted as a single point, confirming the label "Fixed Point," implying it does not have a tunable coverage parameter to generate a full curve like the Conformal Prediction method.
### Interpretation
This chart demonstrates a classic selective classification trade-off. "Selective Risk" is defined as (1 - Accuracy), meaning lower values are better.
The data suggests that the **Modal MLNN Reasoner** is a highly specialized or highly confident model that operates effectively only on a small subset of the data (low coverage), where it achieves very high accuracy (low risk). Conversely, the **BiLSTM + Conformal Prediction** model is designed to be flexible, allowing for varying levels of coverage. However, the steepness of its curve indicates that even at low coverage levels, the BiLSTM model struggles to maintain high accuracy compared to the MLNN Reasoner. As coverage increases toward 1.0 (predicting on all data), the BiLSTM's risk remains very high, suggesting the model is not well-calibrated or inherently inaccurate for this specific dialect task when forced to predict on the full distribution.