## Radar Chart: Model Comparison Across Metrics
### Overview
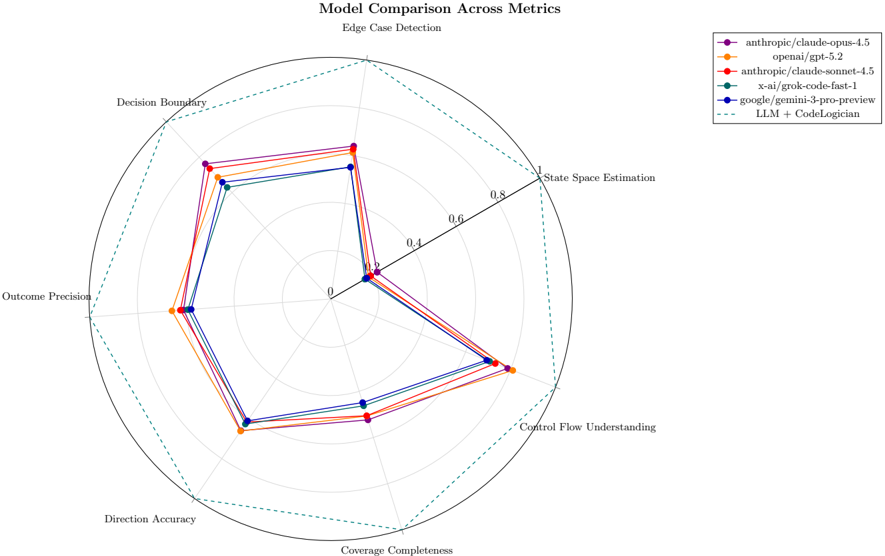
The image is a radar chart comparing the performance of several language models (LLMs) across different metrics related to code understanding and generation. The chart visualizes the strengths and weaknesses of each model in areas such as edge case detection, state space estimation, control flow understanding, coverage completeness, direction accuracy, outcome precision, and decision boundary handling. A larger area covered by a model's line indicates better performance across the metrics.
### Components/Axes
* **Title:** Model Comparison Across Metrics
* **Subtitle:** Edge Case Detection
* **Axes (Metrics):**
* State Space Estimation
* Control Flow Understanding
* Coverage Completeness
* Direction Accuracy
* Outcome Precision
* Decision Boundary
* Edge Case Detection
* **Radial Scale:** 0 to 1, with increments of 0.2 (0, 0.2, 0.4, 0.6, 0.8, 1)
* **Legend (Top-Right):**
* Purple: anthropic/claude-opus-4.5
* Orange: openai/gpt-5.2
* Red: anthropic/claude-sonnet-4.5
* Teal: x-ai/grok-code-fast-1
* Blue: google/gemini-3-pro-preview
* Dashed Green: LLM + CodeLogician
### Detailed Analysis
* **anthropic/claude-opus-4.5 (Purple):**
* Trend: Generally high performance across all metrics.
* Approximate Values: State Space Estimation (0.9), Control Flow Understanding (0.8), Coverage Completeness (0.7), Direction Accuracy (0.7), Outcome Precision (0.8), Decision Boundary (0.8), Edge Case Detection (0.9)
* **openai/gpt-5.2 (Orange):**
* Trend: Similar to anthropic/claude-opus-4.5, but slightly lower in some metrics.
* Approximate Values: State Space Estimation (0.8), Control Flow Understanding (0.7), Coverage Completeness (0.6), Direction Accuracy (0.6), Outcome Precision (0.7), Decision Boundary (0.7), Edge Case Detection (0.8)
* **anthropic/claude-sonnet-4.5 (Red):**
* Trend: Performance is very close to openai/gpt-5.2.
* Approximate Values: State Space Estimation (0.9), Control Flow Understanding (0.7), Coverage Completeness (0.6), Direction Accuracy (0.6), Outcome Precision (0.7), Decision Boundary (0.8), Edge Case Detection (0.9)
* **x-ai/grok-code-fast-1 (Teal):**
* Trend: Slightly lower performance compared to the top three models, but still competitive.
* Approximate Values: State Space Estimation (0.7), Control Flow Understanding (0.6), Coverage Completeness (0.5), Direction Accuracy (0.5), Outcome Precision (0.6), Decision Boundary (0.7), Edge Case Detection (0.7)
* **google/gemini-3-pro-preview (Blue):**
* Trend: Performance is similar to x-ai/grok-code-fast-1.
* Approximate Values: State Space Estimation (0.7), Control Flow Understanding (0.6), Coverage Completeness (0.5), Direction Accuracy (0.5), Outcome Precision (0.6), Decision Boundary (0.7), Edge Case Detection (0.7)
* **LLM + CodeLogician (Dashed Green):**
* Trend: Represents the outer boundary or ideal performance.
* Value: All metrics are at the maximum value of 1.
### Key Observations
* The models anthropic/claude-opus-4.5, openai/gpt-5.2, and anthropic/claude-sonnet-4.5 show the highest performance across all metrics.
* x-ai/grok-code-fast-1 and google/gemini-3-pro-preview have similar performance profiles, slightly below the top three.
* The "LLM + CodeLogician" line represents a theoretical upper bound or target performance level.
### Interpretation
The radar chart provides a visual comparison of different LLMs in the context of code-related tasks. The proximity of the models' lines to the outer "LLM + CodeLogician" boundary indicates their overall effectiveness. The chart highlights the relative strengths and weaknesses of each model, allowing for informed decisions about which model to use for specific applications. The tight clustering of the top three models suggests a high degree of competitiveness in the LLM landscape. The chart suggests that there is still room for improvement in all models, as none of them reach the ideal performance represented by the "LLM + CodeLogician" line.