TECHNICAL ASSET FINGERPRINT
da2177254e014ef054d7c966
Click to view fullscreen
Press ESC or click to close
FOUND IN PAPERS
EXPERT: healer-alpha-free VERSION 1
RUNTIME: free/openrouter/healer-alpha
INTEL_VERIFIED
## Radar Chart: Model Comparison Across Metrics
### Overview
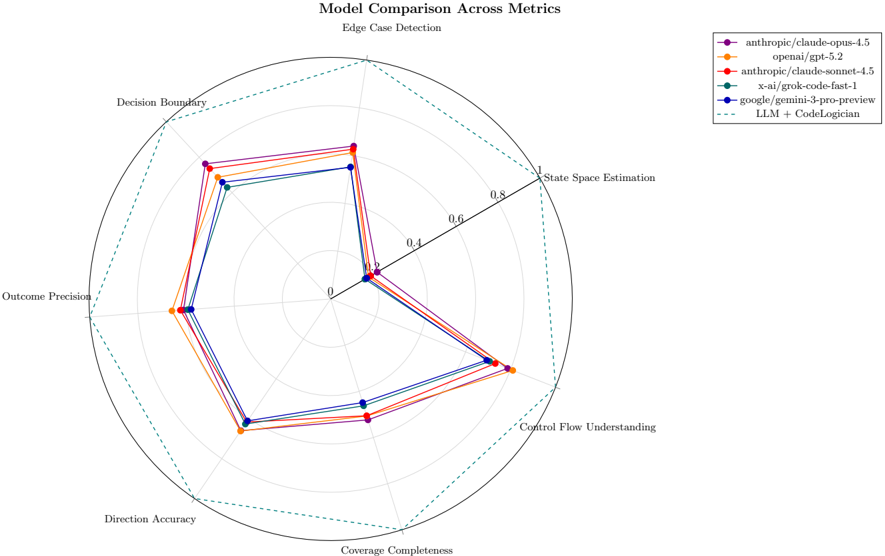
This image is a radar chart (spider plot) titled "Model Comparison Across Metrics," with a subtitle "Edge Case Detection." It visually compares the performance of five different large language models (LLMs) across seven distinct evaluation metrics. The chart uses a radial layout where each metric is represented by an axis radiating from the center, and each model's performance is plotted as a colored polygon.
### Components/Axes
* **Chart Title:** "Model Comparison Across Metrics"
* **Subtitle:** "Edge Case Detection"
* **Axes (Metrics):** Seven axes radiate from the center, each labeled with a metric name. Starting from the top and moving clockwise:
1. Edge Case Detection
2. State Space Estimation
3. Control Flow Understanding
4. Coverage Completeness
5. Direction Accuracy
6. Outcome Precision
7. Decision Boundary
* **Radial Scale:** Concentric circles represent the scale, marked from the center (0) outward to the edge (1). Labeled markers are at 0, 0.4, 0.6, 0.8, and 1.
* **Legend:** Positioned in the top-right corner, outside the main chart circle. It lists the five models with corresponding line colors and markers:
* **Purple line with circle markers:** `anthropic/claude-opus-4.5`
* **Orange line with circle markers:** `openai/gpt-5.2`
* **Red line with circle markers:** `anthropic/claude-sonnet-4.5`
* **Teal/Green line with circle markers:** `x-ai/grok-code-fast-1`
* **Blue line with circle markers:** `google/gemini-3-pro-preview`
* **Dashed teal/green line:** `LLM + CodeLogician` (This appears to be a composite or enhanced system, not a base model).
### Detailed Analysis
Performance values are approximate, read from the radial scale. The trend for each model is described first, followed by estimated values per metric.
**1. `anthropic/claude-opus-4.5` (Purple)**
* **Trend:** Shows strong, consistent performance across most metrics, often leading or near the lead. It has a notable dip in "State Space Estimation."
* **Approximate Values:**
* Edge Case Detection: ~0.85
* State Space Estimation: ~0.35
* Control Flow Understanding: ~0.80
* Coverage Completeness: ~0.75
* Direction Accuracy: ~0.80
* Outcome Precision: ~0.80
* Decision Boundary: ~0.85
**2. `openai/gpt-5.2` (Orange)**
* **Trend:** Very strong and balanced performance, frequently at or near the top across all metrics. It shows the most consistent high-level shape.
* **Approximate Values:**
* Edge Case Detection: ~0.90
* State Space Estimation: ~0.40
* Control Flow Understanding: ~0.85
* Coverage Completeness: ~0.80
* Direction Accuracy: ~0.85
* Outcome Precision: ~0.85
* Decision Boundary: ~0.90
**3. `anthropic/claude-sonnet-4.5` (Red)**
* **Trend:** Performs very similarly to its sibling `claude-opus-4.5`, with nearly identical scores on most axes, suggesting consistent performance within the model family for these tasks.
* **Approximate Values:**
* Edge Case Detection: ~0.85
* State Space Estimation: ~0.35
* Control Flow Understanding: ~0.80
* Coverage Completeness: ~0.75
* Direction Accuracy: ~0.80
* Outcome Precision: ~0.80
* Decision Boundary: ~0.85
**4. `x-ai/grok-code-fast-1` (Teal/Green)**
* **Trend:** Exhibits a distinct performance profile. It is the clear leader in "State Space Estimation" but shows relatively lower performance in "Coverage Completeness" and "Direction Accuracy."
* **Approximate Values:**
* Edge Case Detection: ~0.80
* State Space Estimation: ~0.95 (Highest on this axis)
* Control Flow Understanding: ~0.75
* Coverage Completeness: ~0.65 (Lowest among models on this axis)
* Direction Accuracy: ~0.70 (Lowest among models on this axis)
* Outcome Precision: ~0.75
* Decision Boundary: ~0.80
**5. `google/gemini-3-pro-preview` (Blue)**
* **Trend:** Generally performs in the middle of the pack. It has a notable weakness in "Edge Case Detection" compared to others but is competitive in "Control Flow Understanding" and "Direction Accuracy."
* **Approximate Values:**
* Edge Case Detection: ~0.70 (Lowest among models on this axis)
* State Space Estimation: ~0.40
* Control Flow Understanding: ~0.80
* Coverage Completeness: ~0.75
* Direction Accuracy: ~0.80
* Outcome Precision: ~0.75
* Decision Boundary: ~0.80
**6. `LLM + CodeLogician` (Dashed Teal/Green Line)**
* **Trend:** This dashed line forms the outermost boundary on almost every axis, indicating it represents the highest achieved score (or a theoretical maximum/target) for each metric. It is not a model being tested but likely a benchmark or an augmented system.
* **Approximate Values (Outer Boundary):**
* All metrics: ~1.0 (The line traces the outermost circle labeled "1").
### Key Observations
1. **Universal Weakness:** All base models show a significant performance drop on the "State Space Estimation" metric (values between 0.35-0.40), except for `x-ai/grok-code-fast-1` which excels here (~0.95).
2. **Model Family Similarity:** The two Anthropic models (`claude-opus-4.5` and `claude-sonnet-4.5`) have nearly identical performance profiles on this chart.
3. **Overall Leader:** `openai/gpt-5.2` appears to be the most consistently high-performing model across the seven metrics, with no major weaknesses.
4. **Specialist Model:** `x-ai/grok-code-fast-1` is a specialist, leading dramatically in one area ("State Space Estimation") but lagging in others like "Coverage Completeness."
5. **Benchmark Line:** The `LLM + CodeLogician` dashed line sets a high bar, suggesting that combining an LLM with a specialized tool ("CodeLogician") could theoretically achieve perfect scores (1.0) across all these metrics.
### Interpretation
This radar chart provides a multidimensional view of LLM capabilities for code-related tasks, moving beyond simple accuracy scores. The data suggests:
* **Trade-offs in Model Design:** Different models have different strength profiles. `grok-code-fast-1`'s exceptional "State Space Estimation" might come at the cost of broader "Coverage Completeness," indicating a possible architectural or training focus on abstract reasoning over exhaustive code coverage.
* **The "State Space" Challenge:** The uniformly low scores (except for Grok) on "State Space Estimation" highlight this as a particularly difficult challenge for most leading LLMs, possibly related to understanding the full range of possible program states or configurations.
* **Value of Augmentation:** The `LLM + CodeLogician` line is crucial. It implies that the limitations of individual LLMs (like the universal weakness in state space estimation) might be overcome not just by scaling base models, but by integrating them with specialized external tools or systems (like "CodeLogician"). This points towards a future of composite AI systems rather than monolithic models.
* **Competitive Landscape:** The close clustering of `claude-opus`, `claude-sonnet`, and `gemini-3-pro` on many axes (except edge cases) shows intense competition, with `gpt-5.2` holding a slight but consistent edge in this specific evaluation.
In essence, the chart reveals that while base models are becoming highly capable, they have distinct and sometimes complementary weaknesses. The path to achieving perfect performance (the dashed line) likely lies in strategic augmentation, not just incremental model improvement.
DECODING INTELLIGENCE...