# Technical Document Extraction: Line Chart Analysis
## Labels and Axis Titles
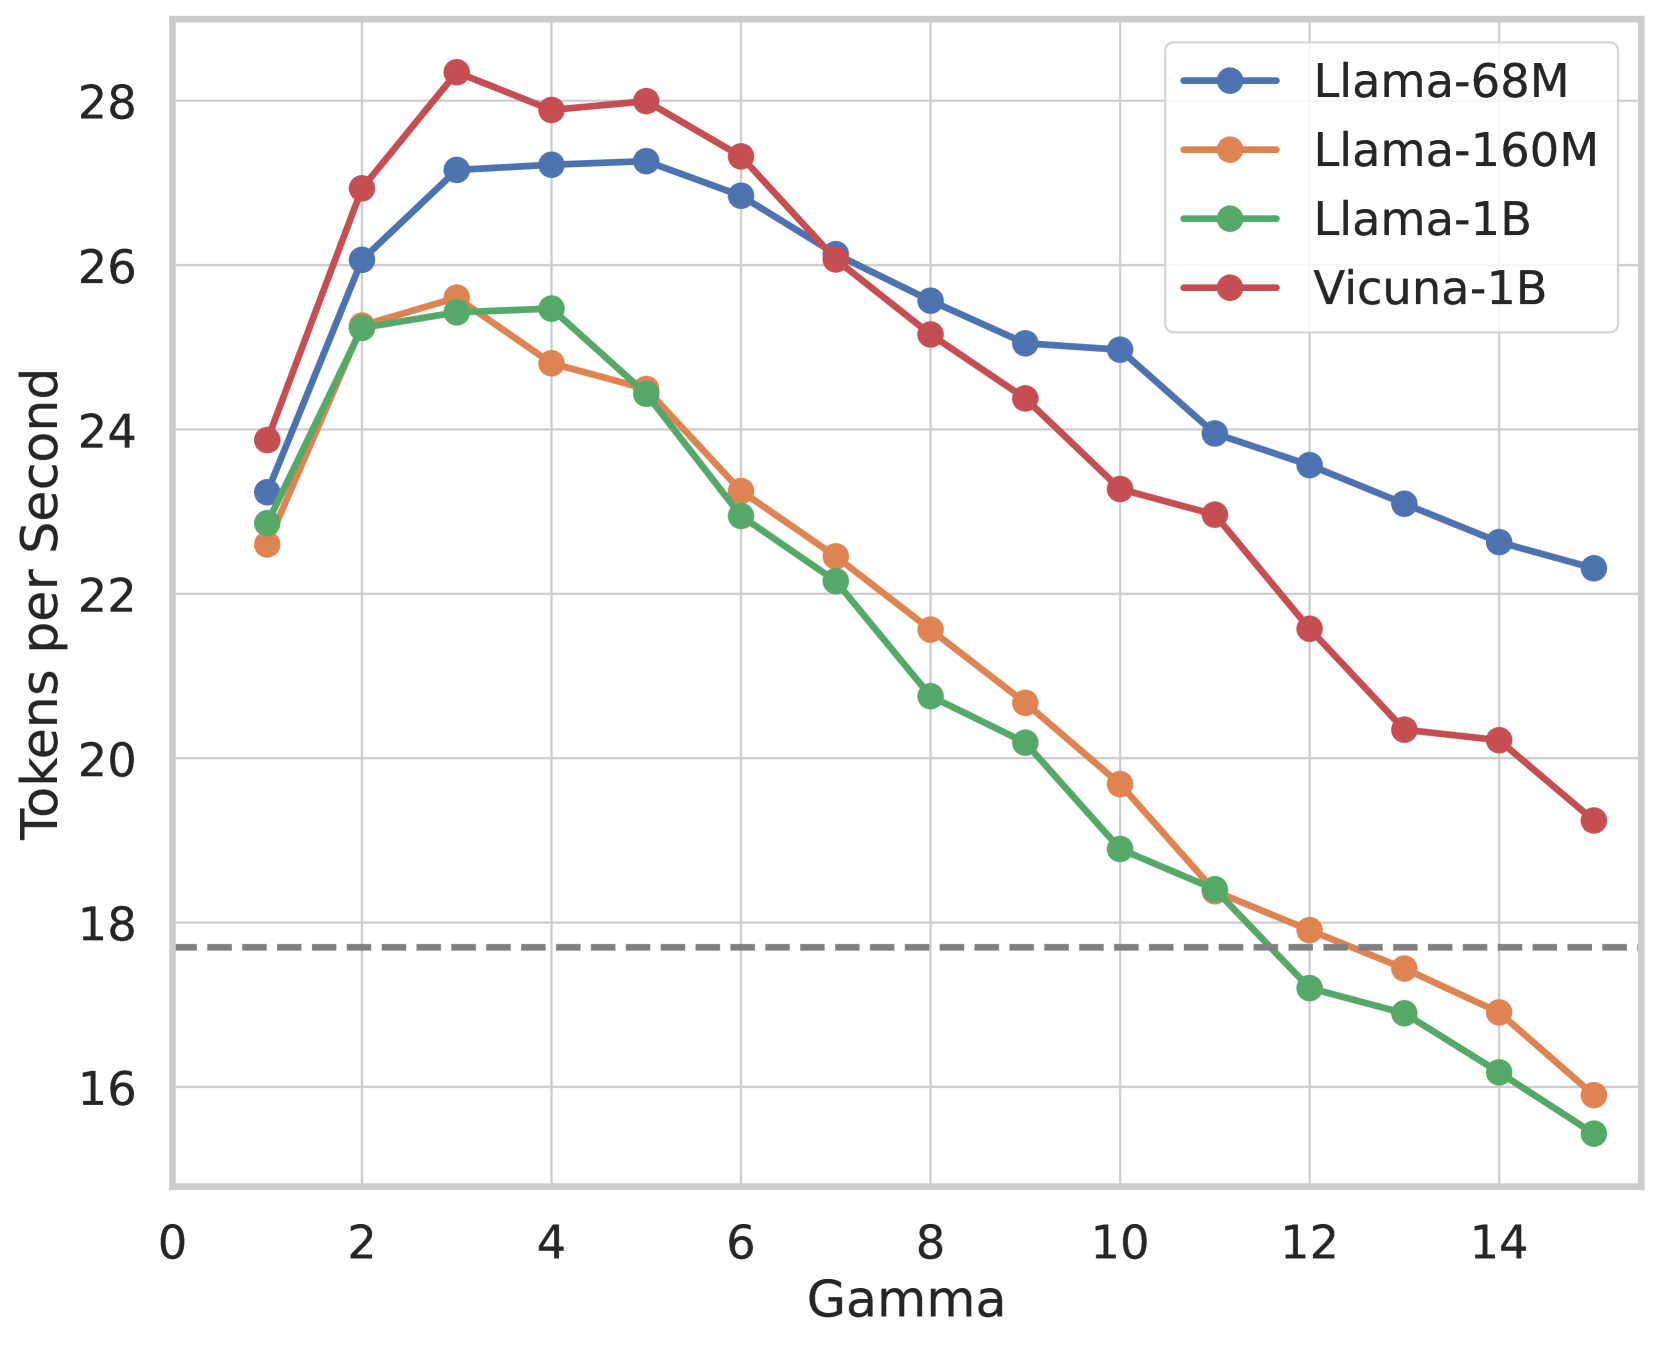
- **X-Axis**: Labeled "Gamma" with tick marks at intervals of 2 (0, 2, 4, ..., 14, 15).
- **Y-Axis**: Labeled "Tokens per Second" with tick marks at intervals of 2 (16, 18, 20, ..., 28).
- **Legend**: Located in the top-right corner, mapping colors to models:
- **Blue**: Llama-68M
- **Orange**: Llama-160M
- **Green**: Llama-1B
- **Red**: Vicuna-1B
## Key Trends and Data Points
1. **Vicuna-1B (Red Line)**:
- Starts at ~24 tokens/sec (Gamma = 0).
- Peaks at ~28.5 tokens/sec (Gamma = 3).
- Declines steadily, reaching ~19 tokens/sec (Gamma = 14).
2. **Llama-68M (Blue Line)**:
- Starts at ~23 tokens/sec (Gamma = 0).
- Peaks at ~27.5 tokens/sec (Gamma = 3).
- Declines to ~22.5 tokens/sec (Gamma = 14).
3. **Llama-160M (Orange Line)**:
- Starts at ~22.5 tokens/sec (Gamma = 0).
- Peaks at ~25.5 tokens/sec (Gamma = 3).
- Declines sharply to ~16 tokens/sec (Gamma = 15).
4. **Llama-1B (Green Line)**:
- Starts at ~22.5 tokens/sec (Gamma = 0).
- Peaks at ~25.5 tokens/sec (Gamma = 3).
- Declines steeply to ~15.5 tokens/sec (Gamma = 15).
5. **Cross-Model Behavior**:
- All models exhibit a peak performance around Gamma = 3.
- Lines intersect between Gamma = 3–4, indicating similar performance in this range.
- By Gamma = 14, only Llama-68M remains above the 18 tokens/sec threshold.
## Threshold Line
- A dashed horizontal line at **18 tokens/sec** is present, serving as a performance benchmark. All models fall below this threshold by Gamma = 14, except Llama-68M.
## Data Point Summary
| Gamma | Llama-68M | Llama-160M | Llama-1B | Vicuna-1B |
|-------|-----------|------------|----------|-----------|
| 0 | ~23 | ~22.5 | ~22.5 | ~24 |
| 3 | ~27.5 | ~25.5 | ~25.5 | ~28.5 |
| 14 | ~22.5 | ~16.5 | ~15.5 | ~19 |
| 15 | ~22 | ~16 | ~15.5 | ~19 |
## Observations
- **Performance Degradation**: All models show a decline in tokens per second after Gamma = 3, with Llama-1B experiencing the steepest drop.
- **Model Efficiency**: Llama-68M maintains the highest performance across all Gamma values, while Llama-1B underperforms significantly at higher Gamma values.
- **Threshold Breach**: By Gamma = 14, only Llama-68M remains above the 18 tokens/sec benchmark.