\n
## Statistical Plots: Normal Distribution and Quantile-Quantile Plots
### Overview
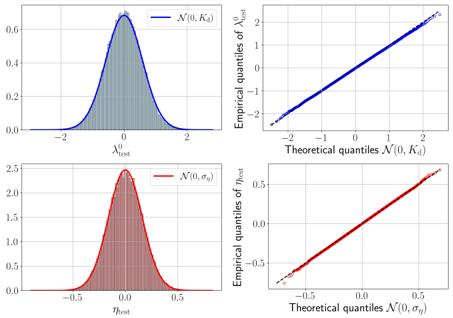
The image presents four statistical plots. The top two plots relate to a normal distribution N(0, K<sub>σ</sub>), while the bottom two relate to a normal distribution N(0, σ<sub>0</sub>). The left-hand plots are histograms showing the probability density function, and the right-hand plots are quantile-quantile (Q-Q) plots comparing the empirical quantiles of a test statistic to the theoretical quantiles of the corresponding normal distribution.
### Components/Axes
* **Top Left (Histogram):**
* X-axis: λ<sub>test</sub> (ranging approximately from -2 to 2)
* Y-axis: Probability Density (ranging approximately from 0 to 0.6)
* Curve Label: N(0, K<sub>σ</sub>) - Blue
* **Top Right (Q-Q Plot):**
* X-axis: Theoretical quantiles N(0, K<sub>σ</sub>) (ranging approximately from -2 to 2)
* Y-axis: Empirical quantiles of λ<sub>test</sub> (ranging approximately from -2 to 2)
* **Bottom Left (Histogram):**
* X-axis: θ<sub>test</sub> (ranging approximately from -0.5 to 0.5)
* Y-axis: Probability Density (ranging approximately from 0 to 2.5)
* Curve Label: N(0, σ<sub>0</sub>) - Red
* **Bottom Right (Q-Q Plot):**
* X-axis: Theoretical quantiles N(0, σ<sub>0</sub>) (ranging approximately from -0.5 to 0.5)
* Y-axis: Empirical quantiles of θ<sub>test</sub> (ranging approximately from -0.5 to 0.5)
### Detailed Analysis or Content Details
* **Top Left Histogram:** The blue curve represents a normal distribution N(0, K<sub>σ</sub>). The distribution is centered around 0, with a spread determined by K<sub>σ</sub>. The peak of the distribution is approximately at 0.6.
* **Top Right Q-Q Plot:** The blue points form a nearly straight line. This indicates that the empirical quantiles of λ<sub>test</sub> closely follow the theoretical quantiles of N(0, K<sub>σ</sub>), suggesting that λ<sub>test</sub> is approximately normally distributed. There is a slight curvature, indicating a possible deviation from perfect normality.
* **Bottom Left Histogram:** The red curve represents a normal distribution N(0, σ<sub>0</sub>). The distribution is centered around 0, with a spread determined by σ<sub>0</sub>. The peak of the distribution is approximately at 2.5.
* **Bottom Right Q-Q Plot:** The red points also form a nearly straight line. This indicates that the empirical quantiles of θ<sub>test</sub> closely follow the theoretical quantiles of N(0, σ<sub>0</sub>), suggesting that θ<sub>test</sub> is approximately normally distributed. There is a slight curvature, indicating a possible deviation from perfect normality.
### Key Observations
* Both λ<sub>test</sub> and θ<sub>test</sub> appear to be approximately normally distributed, as evidenced by the Q-Q plots.
* The distributions N(0, K<sub>σ</sub>) and N(0, σ<sub>0</sub>) have different spreads, as indicated by the histograms. N(0, σ<sub>0</sub>) has a wider spread than N(0, K<sub>σ</sub>).
* The Q-Q plots show slight deviations from a perfectly straight line, suggesting that the normality assumption may not be perfectly met for either λ<sub>test</sub> or θ<sub>test</sub>.
### Interpretation
The image demonstrates the assessment of normality for two test statistics, λ<sub>test</sub> and θ<sub>test</sub>. The histograms visualize the probability density functions of these statistics, while the Q-Q plots provide a more formal assessment of normality by comparing empirical and theoretical quantiles. The near-linear patterns in the Q-Q plots suggest that both statistics are approximately normally distributed, which is a common assumption in many statistical tests. The differences in the spreads of the distributions suggest that K<sub>σ</sub> and σ<sub>0</sub> are different parameters, likely representing different scales or variances. The slight curvature in the Q-Q plots indicates that the normality assumption should be considered cautiously, and further investigation may be warranted to assess the extent of any deviations from normality. The image is a standard diagnostic tool used in statistical modeling to verify model assumptions.