\n
## Diagram: Cognitive Architecture Model
### Overview
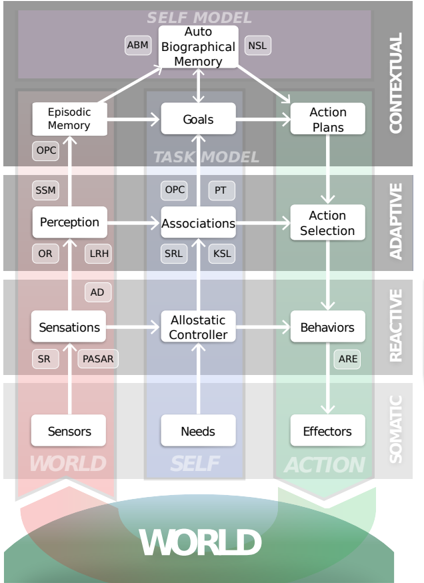
The image depicts a layered cognitive architecture model, illustrating the interaction between different levels of processing – Somatic, Reactive, Adaptive, and Contextual – and their corresponding components. The model represents a hierarchical system where lower levels provide input to higher levels, and higher levels influence lower levels. The diagram uses boxes to represent components, arrows to indicate information flow, and color-coding to delineate the four levels.
### Components/Axes
The diagram is structured into four horizontal layers, labeled from bottom to top:
* **Somatic:** (Red) – Includes "Sensors", "Needs", and "Effectors".
* **Reactive:** (Pink) – Includes "Sensations", "Allostatic Controller", and "Behaviors".
* **Adaptive:** (Green) – Includes "Perception", "Associations", and "Action Selection".
* **Contextual:** (Gray) – Includes "Episodic Memory", "Goals", and "Action Plans", and "Self Model".
Additionally, the diagram includes several sub-components within each layer, denoted by abbreviations. The bottom of the diagram features a large, semi-circular shape labeled "WORLD".
### Detailed Analysis or Content Details
**Somatic Layer (Red):**
* **Sensors:** Receives input from the "WORLD".
* **Needs:** Influences the "Allostatic Controller".
* **Effectors:** Outputs to "ACTION".
**Reactive Layer (Pink):**
* **Sensations:** Receives input from "Sensors".
* **Allostatic Controller:** Receives input from "Sensations" and "Needs", outputs to "Behaviors".
* **Behaviors:** Receives input from "Allostatic Controller", outputs to "ACTION".
**Adaptive Layer (Green):**
* **Perception:** Receives input from "Sensations". Sub-components include: "SSM", "OR", "LRH", "AD".
* **Associations:** Receives input from "Perception". Sub-components include: "OPC", "PT", "SRL", "KSL".
* **Action Selection:** Receives input from "Associations", outputs to "ACTION".
**Contextual Layer (Gray):**
* **Episodic Memory:** Receives input from "Perception". Sub-component: "OPC".
* **Goals:** Receives input from "Episodic Memory".
* **Action Plans:** Receives input from "Goals".
* **Self Model:** Includes "Auto Memory" (ABM), "Biographical Memory", and "NSL". Receives input from "Action Plans".
**Information Flow:**
* Arrows indicate the direction of information flow.
* The "WORLD" provides input to the "Sensors".
* The "ACTION" receives input from "Behaviors" and "Action Selection".
* There is significant reciprocal connection between layers, indicating feedback loops.
### Key Observations
* The model is highly interconnected, with numerous feedback loops.
* The "WORLD" is the primary source of external input.
* The "Self Model" appears to be the highest-level component, integrating information from all other layers.
* The abbreviations within each component suggest specific cognitive processes or modules.
* The diagram emphasizes a hierarchical organization, with lower levels providing foundational input for higher-level processing.
### Interpretation
This diagram represents a cognitive architecture, likely intended to model human cognition. The layered structure suggests a progression from basic sensory input (Somatic) to increasingly complex cognitive processes (Reactive, Adaptive, Contextual). The "Self Model" at the highest level indicates the importance of self-representation and autobiographical knowledge in shaping behavior. The reciprocal connections between layers suggest that cognition is not a purely bottom-up process, but involves constant feedback and interaction between different levels.
The model appears to be inspired by control theory and hierarchical reinforcement learning, where lower levels handle immediate reactions and higher levels plan and strategize. The use of abbreviations suggests a level of technical detail, potentially representing specific algorithms or modules within a computational model. The diagram is a conceptual representation, and the specific implementation of these components would require further elaboration. The model is a simplification of a complex system, but it provides a useful framework for understanding the interplay between different cognitive processes. The diagram does not provide any quantitative data, but rather a qualitative representation of the relationships between cognitive components.