## Line Charts: CLadder Ablation Study
### Overview
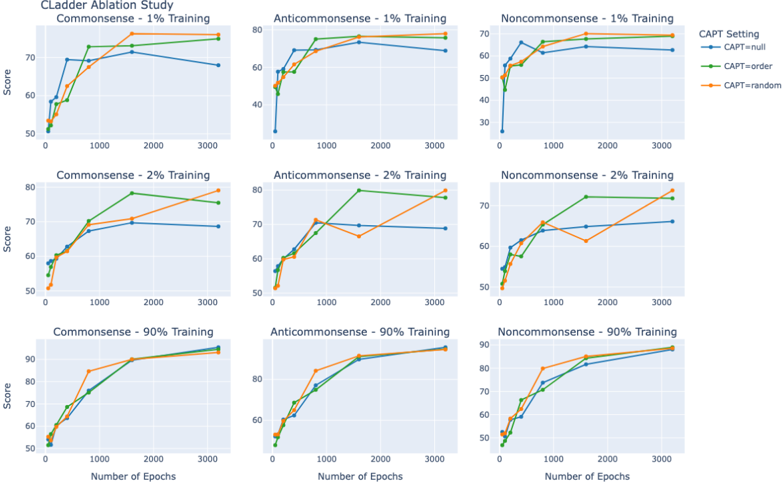
The image presents a series of line charts from the CLadder Ablation Study. Each chart displays the relationship between the number of epochs (x-axis) and the score (y-axis) for different training datasets (Commonsense, Anticommonsense, Noncommonsense) and training percentages (1%, 2%, 90%). The charts compare three CAPT settings: null, order, and random.
### Components/Axes
* **Title:** CLadder Ablation Study
* **X-axis:** Number of Epochs, with markers at 0, 1000, 2000, and 3000.
* **Y-axis:** Score, with markers at 50, 60, 70, 80, and 90 (where applicable).
* **CAPT Setting Legend (Top-Right):**
* Blue line: CAPT=null
* Green line: CAPT=order
* Orange line: CAPT=random
* **Chart Arrangement:** A 3x3 grid, with rows representing different training percentages (1%, 2%, 90%) and columns representing different datasets (Commonsense, Anticommonsense, Noncommonsense).
### Detailed Analysis
**Row 1: 1% Training**
* **Commonsense - 1% Training:**
* CAPT=null (Blue): Increases sharply from approximately 52 to 68 between 0 and 1000 epochs, then plateaus around 68-72 until 3000 epochs.
* CAPT=order (Green): Increases sharply from approximately 52 to 72 between 0 and 1000 epochs, then plateaus around 72-74 until 3000 epochs.
* CAPT=random (Orange): Increases sharply from approximately 52 to 70 between 0 and 1000 epochs, then plateaus around 70-72 until 3000 epochs.
* **Anticommonsense - 1% Training:**
* CAPT=null (Blue): Increases sharply from approximately 35 to 75 between 0 and 1000 epochs, then plateaus around 75-78 until 3000 epochs.
* CAPT=order (Green): Increases sharply from approximately 50 to 78 between 0 and 1000 epochs, then plateaus around 78-80 until 3000 epochs.
* CAPT=random (Orange): Increases sharply from approximately 50 to 75 between 0 and 1000 epochs, then plateaus around 75-78 until 3000 epochs.
* **Noncommonsense - 1% Training:**
* CAPT=null (Blue): Increases sharply from approximately 52 to 65 between 0 and 1000 epochs, then plateaus around 65-68 until 3000 epochs.
* CAPT=order (Green): Increases sharply from approximately 52 to 68 between 0 and 1000 epochs, then plateaus around 68-70 until 3000 epochs.
* CAPT=random (Orange): Increases sharply from approximately 52 to 68 between 0 and 1000 epochs, then plateaus around 68-70 until 3000 epochs.
**Row 2: 2% Training**
* **Commonsense - 2% Training:**
* CAPT=null (Blue): Increases sharply from approximately 55 to 70 between 0 and 1000 epochs, then plateaus around 68-70 until 3000 epochs.
* CAPT=order (Green): Increases sharply from approximately 55 to 75 between 0 and 1000 epochs, then plateaus around 75-78 until 3000 epochs.
* CAPT=random (Orange): Increases sharply from approximately 55 to 70 between 0 and 1000 epochs, then increases to approximately 78-80 until 3000 epochs.
* **Anticommonsense - 2% Training:**
* CAPT=null (Blue): Increases sharply from approximately 55 to 70 between 0 and 1000 epochs, then plateaus around 68-70 until 3000 epochs.
* CAPT=order (Green): Increases sharply from approximately 55 to 72 between 0 and 1000 epochs, then increases to approximately 78-80 until 3000 epochs.
* CAPT=random (Orange): Increases sharply from approximately 55 to 70 between 0 and 1000 epochs, then plateaus around 68-70 until 3000 epochs.
* **Noncommonsense - 2% Training:**
* CAPT=null (Blue): Increases sharply from approximately 52 to 65 between 0 and 1000 epochs, then plateaus around 65-68 until 3000 epochs.
* CAPT=order (Green): Increases sharply from approximately 52 to 68 between 0 and 1000 epochs, then increases to approximately 72-74 until 3000 epochs.
* CAPT=random (Orange): Increases sharply from approximately 52 to 65 between 0 and 1000 epochs, then increases to approximately 72-74 until 3000 epochs.
**Row 3: 90% Training**
* **Commonsense - 90% Training:**
* CAPT=null (Blue): Increases sharply from approximately 55 to 80 between 0 and 1000 epochs, then plateaus around 80-82 until 3000 epochs.
* CAPT=order (Green): Increases sharply from approximately 55 to 90 between 0 and 1000 epochs, then plateaus around 90-92 until 3000 epochs.
* CAPT=random (Orange): Increases sharply from approximately 55 to 90 between 0 and 1000 epochs, then plateaus around 90-92 until 3000 epochs.
* **Anticommonsense - 90% Training:**
* CAPT=null (Blue): Increases sharply from approximately 55 to 80 between 0 and 1000 epochs, then plateaus around 80-82 until 3000 epochs.
* CAPT=order (Green): Increases sharply from approximately 55 to 85 between 0 and 1000 epochs, then plateaus around 85-88 until 3000 epochs.
* CAPT=random (Orange): Increases sharply from approximately 55 to 85 between 0 and 1000 epochs, then plateaus around 85-88 until 3000 epochs.
* **Noncommonsense - 90% Training:**
* CAPT=null (Blue): Increases sharply from approximately 52 to 75 between 0 and 1000 epochs, then plateaus around 75-78 until 3000 epochs.
* CAPT=order (Green): Increases sharply from approximately 52 to 80 between 0 and 1000 epochs, then plateaus around 80-82 until 3000 epochs.
* CAPT=random (Orange): Increases sharply from approximately 52 to 80 between 0 and 1000 epochs, then plateaus around 80-82 until 3000 epochs.
### Key Observations
* All lines generally show a sharp increase in score between 0 and 1000 epochs, followed by a plateau.
* The "CAPT=order" and "CAPT=random" settings often perform similarly, and generally outperform "CAPT=null".
* Increasing the training percentage generally leads to higher scores.
* The Anticommonsense dataset often results in higher scores compared to Commonsense and Noncommonsense, especially with 1% training.
### Interpretation
The data suggests that using "CAPT=order" or "CAPT=random" settings can improve model performance compared to "CAPT=null". Increasing the training data size also generally improves performance. The differences in performance between the datasets (Commonsense, Anticommonsense, Noncommonsense) may indicate varying levels of complexity or inherent learnability within each dataset. The rapid increase in score within the first 1000 epochs suggests diminishing returns for training beyond this point, at least for these specific configurations. The ablation study likely aims to understand the impact of these different settings and datasets on the model's learning process and final performance.