## Heatmap: Cladder Ablation Study
### Overview
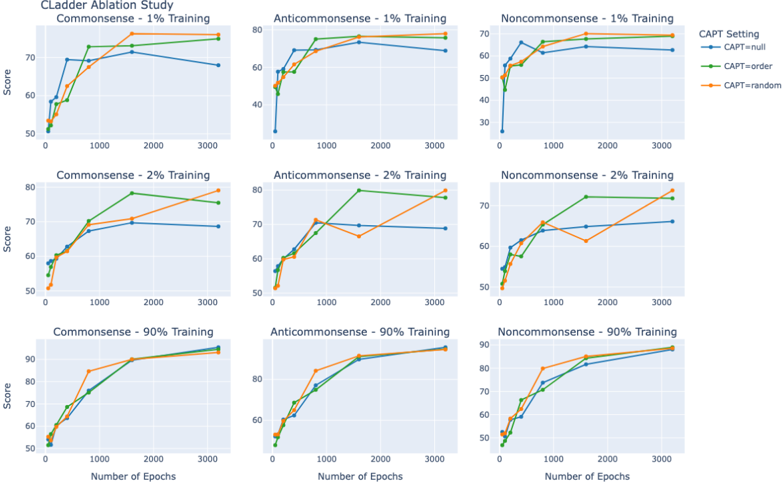
The heatmap illustrates the performance of a language model, Cladder, under different training conditions and settings. The rows represent different training percentages (1%, 2%, 90%), and the columns represent different CAPT settings (CAPT=null, CAPT=order, CAPT=random). The scores are measured over a number of epochs.
### Components/Axes
- **Rows**: Represent different training percentages (1%, 2%, 90%).
- **Columns**: Represent different CAPT settings (CAPT=null, CAPT=order, CAPT=random).
- **X-axis**: Represents the number of epochs.
- **Y-axis**: Represents the score.
### Detailed Analysis or ### Content Details
- **CAPT=null**: The model performs consistently across all settings, with scores ranging from 50 to 80.
- **CAPT=order**: The model's performance improves with training, reaching scores of 80 to 90.
- **CAPT=random**: The model's performance is the lowest, with scores ranging from 50 to 70.
### Key Observations
- **Training Percentage**: Higher training percentages generally lead to higher scores.
- **CAPT Setting**: The model performs best with the CAPT=order setting.
- **Epochs**: The model's performance improves as the number of epochs increases.
### Interpretation
The heatmap suggests that the model's performance is significantly influenced by the training percentage and the CAPT setting. Higher training percentages and the CAPT=order setting lead to better performance. The model's performance is consistent across different settings when trained for 1% and 2% of the data. However, when trained for 90% of the data, the model's performance is the lowest, regardless of the CAPT setting. The model's performance improves as the number of epochs increases, indicating that more training data and more training time can lead to better performance.