## Candlestick Chart: Price Movement Analysis (Mar 14 - May 23, 2021)
### Overview
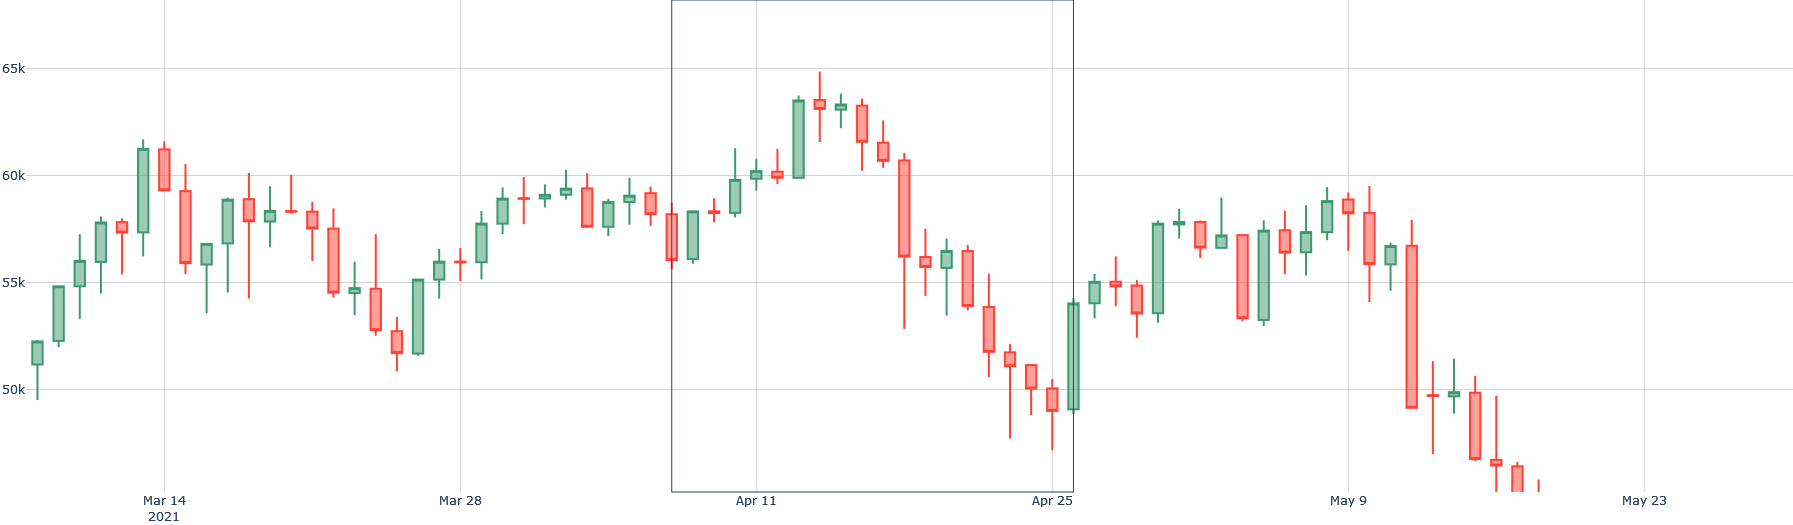
The image displays a candlestick chart tracking price movements over time, with dates on the x-axis (March 14 to May 23, 2021) and price values on the y-axis (50k to 65k). Green candlesticks represent upward price movements, while red candlesticks indicate declines. The chart shows significant volatility with multiple peaks, troughs, and trend reversals.
### Components/Axes
- **X-Axis**: Dates (Mar 14, Mar 15, ..., May 23) spaced at daily intervals.
- **Y-Axis**: Price values labeled in increments of 5k (50k, 55k, 60k, 65k).
- **Legend**: Implied by candlestick colors:
- **Green**: Price increased (close > open).
- **Red**: Price decreased (close < open).
- **Gridlines**: Horizontal lines at 5k intervals for reference.
### Detailed Analysis
1. **Early March (Mar 14-18)**:
- Price starts at ~52k, rises to ~61k by Mar 15 (green candles).
- Sharp decline to ~54k by Mar 18 (red candles).
2. **Mid-March (Mar 19-28)**:
- Volatile range between ~54k and ~59k.
- Notable green candle on Mar 23 (price closes at ~58k).
3. **Early April (Apr 11-15)**:
- Sharp upward trend to ~64k (green candles).
- Followed by a steep drop to ~55k by Apr 16 (red candles).
4. **Mid-April (Apr 16-25)**:
- Price oscillates between ~50k and ~57k.
- Significant red candle on Apr 25 (price closes at ~50k).
5. **Early May (May 9-15)**:
- Price rises to ~58k (green candles) before dropping to ~52k (red candles).
6. **Late May (May 16-23)**:
- Steep decline from ~52k to ~45k (red candles).
- Final candlestick on May 23 closes at ~44k.
### Key Observations
- **Peaks**: Highest price (~64k) on Apr 14; lowest price (~44k) on May 23.
- **Volatility**: Multiple sharp reversals (e.g., Apr 14-15, Apr 25-26).
- **Downtrend**: Sustained decline from Apr 16 to May 23, with no recovery above 58k.
- **Outliers**:
- Apr 14: Sharp spike to 64k (potential catalyst event).
- May 15: Abrupt drop from 58k to 52k (possible market correction).
### Interpretation
The chart suggests a bearish trend over the observed period, with price failing to sustain gains after initial rallies. The prolonged decline from Apr 16 to May 23 indicates strong selling pressure or negative market sentiment. The Apr 14 spike may reflect a temporary positive catalyst (e.g., earnings report, news event), but the subsequent drop suggests profit-taking or loss of confidence. The lack of recovery above 58k after May 9 implies a loss of momentum in upward movement. This pattern could signal a bear market phase or sector-specific downturn, warranting further analysis of external factors (e.g., economic data, company-specific news).