## Diagram: Sudoku State Transition
### Overview
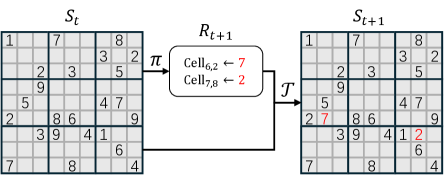
The image depicts a state transition diagram for a Sudoku puzzle. It shows an initial state (St), an action/reward step (Rt+1), and the resulting state (St+1) after applying the action. The diagram illustrates how filling in specific cells in the Sudoku grid transforms the puzzle from one state to another.
### Components/Axes
* **St**: Represents the initial state of the Sudoku puzzle. It's a 9x9 grid with some cells filled with numbers.
* **Rt+1**: Represents the reward or action taken. It indicates which cells are filled and with what numbers.
* **St+1**: Represents the resulting state of the Sudoku puzzle after applying the action. It's a 9x9 grid with additional cells filled compared to St.
* **π**: Represents the policy or strategy used to select the action.
* **T**: Represents the transition function that maps the current state and action to the next state.
### Detailed Analysis
**Initial State (St):**
The Sudoku grid in the initial state (St) has the following values:
* Row 1: 1, _, 7, _, _, _, 8, _, _
* Row 2: _, _, _, 3, _, 2, _, _, _
* Row 3: _, 2, 3, _, _, 5, _, _, _
* Row 4: _, 9, _, _, _, _, _, _, _
* Row 5: _, 5, _, _, _, 4, 7, _, _
* Row 6: 2, _, 8, 6, _, _, _, _, 9
* Row 7: _, 3, 9, _, 4, 1, _, _, _
* Row 8: _, _, _, _, _, _, 6, _, _
* Row 9: 7, _, _, 8, _, _, _, _, 4
**Action/Reward (Rt+1):**
The action/reward step (Rt+1) indicates that two cells are filled:
* Cell (6,2) is filled with the number 7 (shown in red).
* Cell (7,8) is filled with the number 2 (shown in red).
**Resulting State (St+1):**
The Sudoku grid in the resulting state (St+1) has the following values:
* Row 1: 1, _, 7, _, _, _, 8, _, _
* Row 2: _, _, _, 3, _, 2, _, _, _
* Row 3: _, 2, 3, _, _, 5, _, _, _
* Row 4: _, 9, _, _, _, _, _, _, _
* Row 5: _, 5, _, _, _, 4, 7, _, _
* Row 6: 2, 7, 8, 6, _, _, _, _, 9
* Row 7: _, 3, 9, _, 4, 1, _, 2, _
* Row 8: _, _, _, _, _, _, 6, _, _
* Row 9: 7, _, _, 8, _, _, _, _, 4
### Key Observations
* The diagram shows a single step in solving a Sudoku puzzle.
* The action involves filling two specific cells with numbers.
* The numbers filled in the action/reward step are highlighted in red in the Rt+1 and St+1 states.
* The policy (π) and transition function (T) are abstract representations of the Sudoku solving strategy.
### Interpretation
The diagram illustrates a basic reinforcement learning approach to solving Sudoku puzzles. The initial state (St) represents the current puzzle configuration. The policy (π) guides the selection of an action, which in this case is filling specific cells. The reward (Rt+1) is associated with the action, and the transition function (T) updates the puzzle state to the next state (St+1). By repeatedly applying this process, the agent (Sudoku solver) aims to reach a solved state. The red numbers highlight the changes made during the transition, emphasizing the impact of the action on the puzzle.