## Diagram: Tree Structure
### Overview
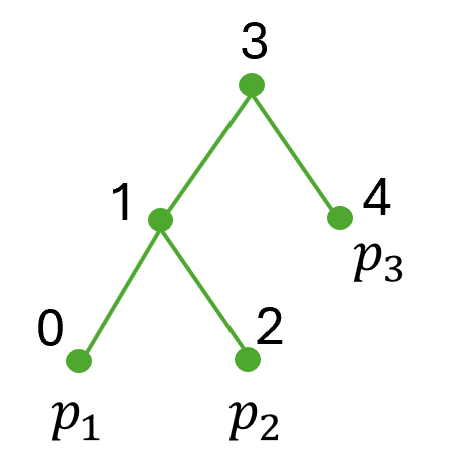
The image depicts a tree diagram with nodes labeled with numbers and variables. The tree has a hierarchical structure, branching from a root node to several leaf nodes. All nodes are green.
### Components/Axes
* **Nodes:** Represented by green circles, each labeled with a number.
* Node 0
* Node 1
* Node 2
* Node 3
* Node 4
* **Edges:** Represented by green lines connecting the nodes, indicating the relationships between them.
* **Labels:** Each node has a numerical label and some nodes have an additional variable label.
* Node 0 is labeled with "0" and "p₁"
* Node 1 is labeled with "1"
* Node 2 is labeled with "2" and "p₂"
* Node 3 is labeled with "3"
* Node 4 is labeled with "4" and "p₃"
### Detailed Analysis or ### Content Details
The tree structure can be described as follows:
* Node 1 is the parent node, connected to nodes 0 and 2.
* Node 3 is the parent node, connected to nodes 1 and 4.
* Nodes 0, 2, and 4 are leaf nodes.
The connections are:
* Node 3 connects to Node 1.
* Node 3 connects to Node 4.
* Node 1 connects to Node 0.
* Node 1 connects to Node 2.
### Key Observations
* The tree has a clear hierarchical structure with a single root (Node 3).
* The nodes are labeled with consecutive numbers, but the numbering doesn't seem to follow a strict depth-first or breadth-first traversal.
* The variables p₁, p₂, and p₃ are associated with the leaf nodes 0, 2, and 4, respectively.
### Interpretation
The diagram likely represents a decision tree or a similar hierarchical structure used in computer science or mathematics. The numerical labels could represent states, steps, or indices, while the variables p₁, p₂, and p₃ might represent probabilities or parameters associated with the leaf nodes. The tree structure visualizes the relationships and dependencies between these elements.