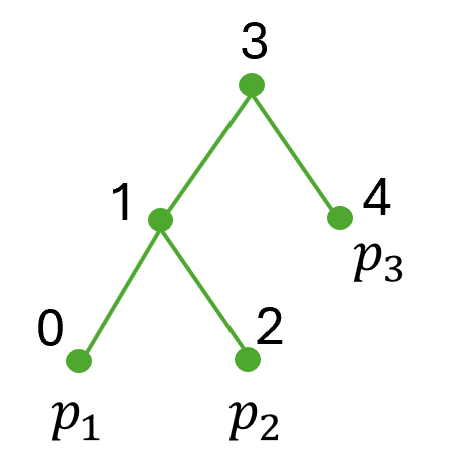
## Diagram: Hierarchical Tree Structure with Labeled Nodes
### Overview
The image displays a simple hierarchical tree diagram composed of five circular nodes connected by straight lines. The nodes are numbered from 0 to 4, and three of the nodes have associated labels (p₁, p₂, p₃). The structure suggests a parent-child relationship, with node 3 at the apex.
### Components/Axes
* **Nodes:** Five green circular nodes.
* **Node Labels (Numbers):** Each node has a black numeral placed directly above it: `0`, `1`, `2`, `3`, `4`.
* **Node Labels (Variables):** Three nodes have a black variable label placed directly below them:
* Node `0` is labeled `p₁`.
* Node `2` is labeled `p₂`.
* Node `4` is labeled `p₃`.
* **Edges:** Straight green lines connecting the nodes, indicating relationships or flow.
* **Spatial Layout:** The diagram is arranged in a top-down hierarchy.
* **Top Level (Root):** Node `3` is positioned at the top center.
* **Middle Level:** Node `1` is positioned to the left and below node `3`. Node `4` is positioned to the right and below node `3`.
* **Bottom Level:** Node `0` is positioned to the left and below node `1`. Node `2` is positioned to the right and below node `1`.
### Detailed Analysis
The diagram explicitly defines the following connections (edges):
1. A green line connects Node `3` (top) to Node `1` (middle-left).
2. A green line connects Node `3` (top) to Node `4` (middle-right).
3. A green line connects Node `1` (middle-left) to Node `0` (bottom-left).
4. A green line connects Node `1` (middle-left) to Node `2` (bottom-right).
This creates a binary tree structure where:
* Node `3` is the parent of nodes `1` and `4`.
* Node `1` is the parent of nodes `0` and `2`.
* Nodes `0`, `2`, and `4` are leaf nodes (they have no children).
* The variable labels `p₁`, `p₂`, and `p₃` are associated with the leaf nodes `0`, `2`, and `4`, respectively.
### Key Observations
* The structure is a **strict binary tree** (each parent has at most two children).
* The numbering does not follow a standard traversal order (e.g., in-order, pre-order). Node `4` is a right child of the root but is numbered higher than its sibling `1`.
* The variable labels (`p₁`, `p₂`, `p₃`) are only applied to the terminal (leaf) nodes of the tree.
* All visual elements (nodes, edges) are green; all text (numbers, variables) is black.
### Interpretation
This diagram most likely represents a **decision tree, a process flow, or a hierarchical data structure**. The numbered nodes could represent states, steps, or decision points, while the labeled leaf nodes (`p₁`, `p₂`, `p₃`) likely represent final outcomes, parameters, or probabilities associated with reaching that terminal state.
The structure implies that starting from an initial state (Node `3`), one can follow a path of decisions or transitions (the edges) to arrive at one of three possible terminal states. For example:
* Path: `3` -> `1` -> `0` leads to outcome `p₁`.
* Path: `3` -> `1` -> `2` leads to outcome `p₂`.
* Path: `3` -> `4` leads to outcome `p₃`.
The asymmetry (Node `1` having two children while Node `4` is a leaf) suggests that the process or model is more complex or has more possible outcomes on the left branch than on the right. The use of `p` notation often signifies probability in such models, hinting that `p₁`, `p₂`, and `p₃` could be the probabilities of ending in each respective leaf node.