## Tree Diagram: Hierarchical Structure with Labeled Nodes
### Overview
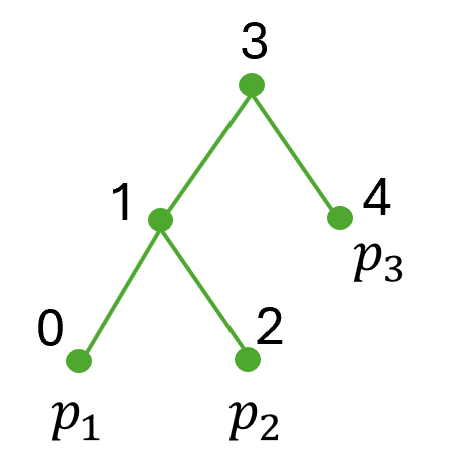
The image depicts a hierarchical tree diagram with five nodes (0–4) connected by green edges. Each node is labeled with a numerical identifier, and three leaf nodes (0, 2, 4) are additionally annotated with lowercase "p" labels (p₁, p₂, p₃). The root node is 3, which bifurcates into two subtrees.
### Components/Axes
- **Nodes**:
- Root node: **3** (no "p" label).
- Intermediate nodes: **1** (left child of 3), **4** (right child of 3).
- Leaf nodes: **0** (left child of 1), **2** (right child of 1), **4** (right child of 3).
- **Labels**:
- Numerical identifiers: **0, 1, 2, 3, 4** (positioned above each node).
- "p" labels:
- **p₁** (below node 0),
- **p₂** (below node 2),
- **p₃** (below node 4).
- **Edges**:
- Green lines connect parent nodes to children (e.g., 3→1, 3→4, 1→0, 1→2).
- **No legends, axes, or scales** are present.
### Detailed Analysis
- **Node 3** (root) splits into two branches:
- Left branch: Node **1** → splits into **0** (p₁) and **2** (p₂).
- Right branch: Node **4** (p₃, no further children).
- **p₁, p₂, p₃** are exclusively assigned to leaf nodes (0, 2, 4), suggesting they represent terminal states or outcomes.
- The diagram lacks directional flow indicators (e.g., arrows), but the hierarchical structure implies a top-down traversal from root to leaves.
### Key Observations
1. **Root Dominance**: Node 3 is the sole root, with no parent connections.
2. **Asymmetric Branching**:
- Left subtree (under node 1) has two children (0, 2).
- Right subtree (under node 4) is a terminal node.
3. **Label Consistency**:
- Numerical labels (0–4) are unique and sequential.
- "p" labels (p₁, p₂, p₃) are distinct and map one-to-one with leaf nodes.
### Interpretation
This diagram likely represents a decision tree, state machine, or hierarchical classification system. The root (node 3) acts as the initial decision point, branching into intermediate states (1, 4) and terminal outcomes (p₁, p₂, p₃). The absence of loops or feedback edges suggests a strictly acyclic structure. The "p" labels may denote parameters, probabilities, or outcomes specific to each terminal state. The asymmetry in branching could reflect varying complexity or decision paths in the modeled system.