## Heatmap Visualization: Structured vs. Unstructured Configurations
### Overview
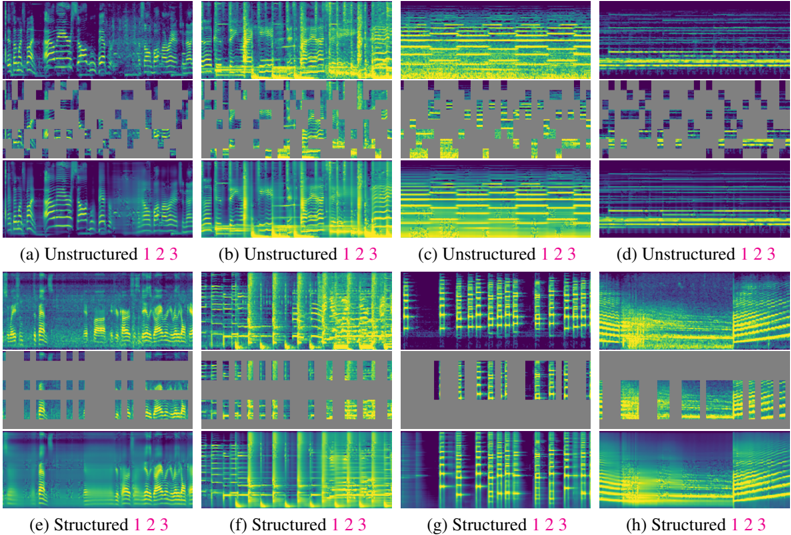
The image presents eight heatmaps (labeled a-h) comparing "Structured" and "Unstructured" configurations across three categories (1, 2, 3). Each panel displays a 3x3 grid of color-coded values, with variations in intensity and distribution. The heatmaps use a blue-to-yellow gradient, likely representing magnitude or frequency, though no explicit legend is provided.
### Components/Axes
- **Rows**:
- Top row: "Unstructured 1 2 3" (panels a-d)
- Middle row: "Structured 1 2 3" (panels e-h)
- **Columns**:
- Left column: "Unstructured 1 2 3" (panels a, e)
- Right column: "Structured 1 2 3" (panels b, f, g, h)
- **Heatmap Labels**:
- Panels a-d: "Unstructured 1 2 3"
- Panels e-h: "Structured 1 2 3"
- **Color Gradient**: Blue (low values) to Yellow (high values), no explicit legend.
### Detailed Analysis
#### Unstructured Configurations (a-d)
- **Panel a**: Vertical stripes dominate, with alternating blue and yellow bands.
- **Panel b**: Horizontal stripes with sparse yellow blocks.
- **Panel c**: Scattered yellow blocks on a blue background, suggesting localized high values.
- **Panel d**: Uniform blue with faint yellow streaks, indicating minimal variation.
#### Structured Configurations (e-h)
- **Panel e**: Vertical stripes with consistent spacing, resembling a grid.
- **Panel f**: Horizontal stripes with dense yellow blocks, suggesting higher values.
- **Panel g**: Vertical stripes with sharp transitions, indicating abrupt changes.
- **Panel h**: Grid-like pattern with alternating blue and yellow blocks, showing structured regularity.
### Key Observations
1. **Structured vs. Unstructured**:
- Structured configurations (e-h) exhibit more organized patterns (stripes, grids) compared to unstructured (a-d), which show irregular or sparse distributions.
- Structured panels (f, h) have higher yellow intensity, implying greater magnitude or frequency.
2. **Color Trends**:
- Yellow regions (high values) are more concentrated in structured configurations, particularly in panels f and h.
- Unstructured panels (a, c) show fragmented or isolated yellow areas.
3. **Missing Legend**:
- The absence of a legend prevents precise interpretation of color values. However, the blue-to-yellow gradient likely represents a scale from low to high.
### Interpretation
The visual data suggests that structured configurations produce more consistent and organized patterns, potentially indicating improved performance or stability. Unstructured configurations exhibit variability, with some panels (e.g., c) showing localized high values but no clear trend. The lack of a legend limits quantitative analysis, but the spatial distribution of colors implies that structured approaches may yield more predictable outcomes.
### Notes
- No numerical data or explicit axis titles are present.
- All text is in English; no other languages are detected.
- The heatmaps lack a legend, so color interpretation relies on visual inference.