TECHNICAL ASSET FINGERPRINT
da8091bdfa950803c535b836
Click to view fullscreen
Press ESC or click to close
FOUND IN PAPERS
EXPERT: healer-alpha-free VERSION 1
RUNTIME: free/openrouter/healer-alpha
INTEL_VERIFIED
## Multi-Panel Line Chart: Sequential Task Learning Loss Curves
### Overview
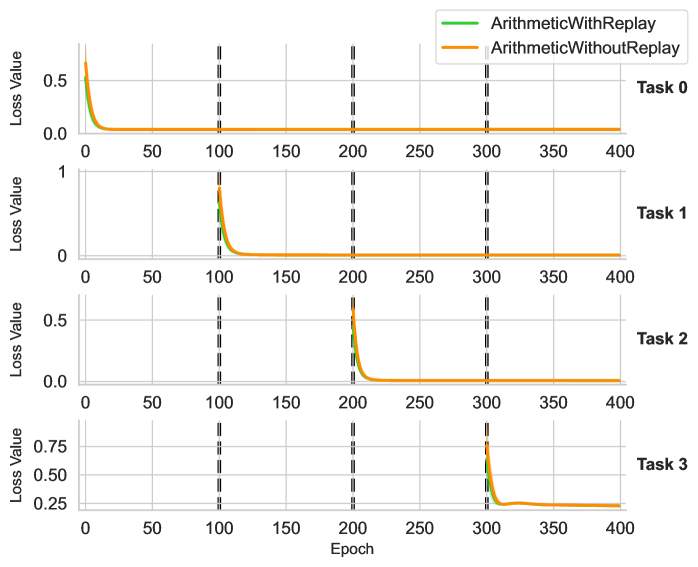
The image displays a vertical arrangement of four line charts, each tracking the "Loss Value" over 400 training "Epochs" for a sequential learning experiment. The charts compare two methods: "ArithmeticWithReplay" (green line) and "ArithmeticWithoutReplay" (orange line). Each subplot corresponds to a distinct task (Task 0 through Task 3) introduced at different points in the training sequence. Vertical dashed lines mark epoch boundaries at 100, 200, and 300.
### Components/Axes
* **Legend:** Located at the top-right of the overall figure. It contains two entries:
* `ArithmeticWithReplay` - Represented by a solid green line.
* `ArithmeticWithoutReplay` - Represented by a solid orange line.
* **Subplot Structure:** Four subplots are stacked vertically.
* **Y-axis (for all subplots):** Labeled "Loss Value". The scale varies per subplot:
* Task 0: 0.0 to ~0.6
* Task 1: 0 to 1
* Task 2: 0.0 to ~0.6
* Task 3: 0.25 to ~0.85
* **X-axis (shared, labeled at the bottom):** Labeled "Epoch". Linear scale from 0 to 400, with major ticks at 0, 50, 100, 150, 200, 250, 300, 350, 400.
* **Task Labels:** Positioned to the right of each subplot, aligned with the top of its y-axis.
* Top subplot: `Task 0`
* Second subplot: `Task 1`
* Third subplot: `Task 2`
* Bottom subplot: `Task 3`
* **Vertical Dashed Lines:** Three black, dashed vertical lines cross all subplots at approximately `Epoch = 100`, `Epoch = 200`, and `Epoch = 300`.
### Detailed Analysis
**Task 0 (Top Subplot):**
* **Trend:** Both lines start at a high loss (~0.6) at epoch 0 and decay rapidly to near zero by epoch ~25. They remain flat at near-zero loss for the remainder of the 400 epochs.
* **Data Points (Approximate):**
* Start (Epoch 0): Loss ≈ 0.6 for both lines.
* Convergence (Epoch ~25): Loss ≈ 0.0.
* End (Epoch 400): Loss ≈ 0.0.
**Task 1 (Second Subplot):**
* **Trend:** Loss is near zero until epoch 100. At epoch 100, both lines spike sharply (green to ~0.7, orange to ~0.8) and then decay rapidly, converging to near zero by epoch ~125. They remain flat thereafter.
* **Data Points (Approximate):**
* Pre-spike (Epoch 99): Loss ≈ 0.0.
* Spike (Epoch 100): Green ≈ 0.7, Orange ≈ 0.8.
* Convergence (Epoch ~125): Loss ≈ 0.0.
* End (Epoch 400): Loss ≈ 0.0.
**Task 2 (Third Subplot):**
* **Trend:** Loss is near zero until epoch 200. At epoch 200, both lines spike sharply (green to ~0.5, orange to ~0.6) and decay rapidly, converging to near zero by epoch ~225. They remain flat thereafter.
* **Data Points (Approximate):**
* Pre-spike (Epoch 199): Loss ≈ 0.0.
* Spike (Epoch 200): Green ≈ 0.5, Orange ≈ 0.6.
* Convergence (Epoch ~225): Loss ≈ 0.0.
* End (Epoch 400): Loss ≈ 0.0.
**Task 3 (Bottom Subplot):**
* **Trend:** Loss is near zero until epoch 300. At epoch 300, both lines spike sharply (green to ~0.75, orange to ~0.85). They decay but **do not return to zero**. Instead, they plateau at a significantly higher loss level (~0.25) from approximately epoch 325 onward.
* **Data Points (Approximate):**
* Pre-spike (Epoch 299): Loss ≈ 0.0.
* Spike (Epoch 300): Green ≈ 0.75, Orange ≈ 0.85.
* Plateau (Epoch 325-400): Both lines stabilize at Loss ≈ 0.25.
### Key Observations
1. **Task Introduction Points:** The vertical dashed lines at epochs 100, 200, and 300 perfectly coincide with the sudden loss spikes in Tasks 1, 2, and 3, respectively. This strongly indicates these are the points where new tasks are introduced to the model.
2. **Catastrophic Forgetting Pattern:** For Tasks 0, 1, and 2, the loss spikes upon introduction but then decays to zero, indicating successful learning. The flat lines after convergence suggest the model retains performance on earlier tasks (no visible increase in loss for Task 0 after epochs 100, 200, or 300).
3. **Anomaly in Task 3:** Task 3 exhibits a fundamentally different pattern. The loss does not converge to zero but plateaus at a high value (~0.25). This suggests the model fails to fully learn or generalize this final task.
4. **Method Comparison:** The "ArithmeticWithoutReplay" (orange) line consistently shows a slightly higher peak loss at the moment of task introduction compared to "ArithmeticWithReplay" (green). However, their convergence behavior and final plateau values are nearly identical within each task.
### Interpretation
This chart visualizes a continual or sequential learning experiment, likely testing a method to mitigate **catastrophic forgetting** (where learning a new task causes forgetting of old ones). The "Replay" in the legend likely refers to a technique where data or representations from previous tasks are interleaved during new task training.
* **What the data suggests:** The experiment demonstrates successful sequential learning of three arithmetic tasks (0, 1, 2) with no visible forgetting, as loss on earlier tasks remains low after new tasks are introduced. The "Replay" method results in slightly lower initial loss spikes, suggesting it provides a modest stabilization benefit during the initial phase of learning a new task.
* **The Task 3 Anomaly:** The failure to reduce loss on Task 3 is the most critical finding. This could indicate several possibilities: Task 3 is inherently more difficult, the model's capacity is exhausted after learning three tasks, or the replay buffer/method is insufficient for this particular task. The plateau suggests the model has reached a performance limit it cannot improve upon.
* **Relationship Between Elements:** The vertical dashed lines are not just markers; they are causal triggers. The system's state changes at these points, forcing adaptation. The near-identical final performance of both methods (except for the initial spike) implies that for this specific set of tasks, the core replay mechanism may not be the differentiating factor for final accuracy, but rather for training stability.
* **Peircean Investigation:** The chart is an *index* of a training process. The spikes are *signs* of task boundaries. The plateau in Task 3 is a *symptom* of a learning limitation. A researcher viewing this would hypothesize that the model architecture or learning algorithm has a fixed capacity that was saturated by the fourth task, or that Task 3's data distribution is significantly different from the first three. The next logical experiment would be to analyze Task 3's characteristics or increase model capacity.
DECODING INTELLIGENCE...