## Chart: Mass, Velocity, and Altitude of a Rocket
### Overview
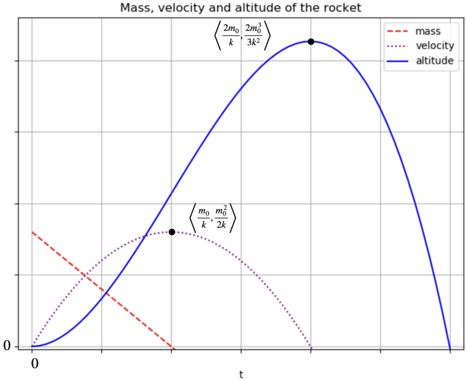
The image is a graph depicting the mass, velocity, and altitude of a rocket over time. The x-axis represents time (t), and the y-axis represents the values of mass, velocity, and altitude. The graph shows how these three parameters change over time.
### Components/Axes
* **Title:** Mass, velocity and altitude of the rocket
* **X-axis:** t (time)
* **Y-axis:** Implicitly represents the values of mass, velocity, and altitude. No explicit label is given.
* **Legend:** Located in the top-right corner.
* Red dashed line: mass
* Purple dotted line: velocity
* Blue solid line: altitude
* **Axis Markers:** The x and y axes both start at 0.
### Detailed Analysis
* **Mass (Red dashed line):** The mass decreases linearly from an initial value to zero over time.
* **Velocity (Purple dotted line):** The velocity starts at zero, increases to a maximum value, and then decreases back to zero. The maximum velocity is marked with a black dot at approximately (m₀/k, m₀²/2k).
* **Altitude (Blue solid line):** The altitude starts at zero, increases to a maximum value, and then decreases back to zero. The maximum altitude is marked with a black dot at approximately (2m₀/k, 2m₀³/3k²).
### Key Observations
* The mass decreases linearly with time.
* The velocity curve is parabolic, reaching a maximum before decreasing.
* The altitude curve is also parabolic, reaching a maximum later than the velocity and then decreasing.
* The point of maximum velocity is (m₀/k, m₀²/2k).
* The point of maximum altitude is (2m₀/k, 2m₀³/3k²).
### Interpretation
The graph illustrates a simplified model of a rocket's flight. The mass decreases as fuel is burned. The velocity increases as the rocket accelerates, reaches a peak, and then decreases, likely due to gravity and air resistance. The altitude increases as the rocket ascends, reaches a maximum height, and then decreases as the rocket falls back to the ground. The relationships between mass, velocity, and altitude are interconnected, with the decreasing mass contributing to the changes in velocity and altitude. The specific values at the maximum points provide information about the rocket's performance characteristics.