\n
## Chart: Rocket Mass, Velocity, and Altitude
### Overview
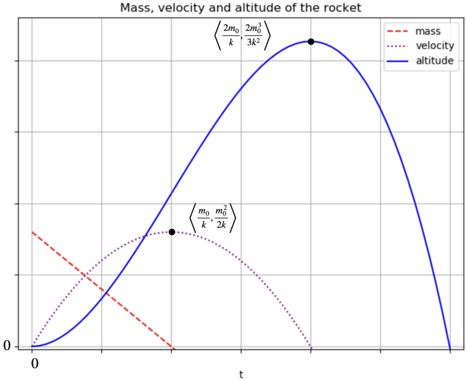
The image presents a line chart illustrating the changes in mass, velocity, and altitude of a rocket over time. The x-axis represents time ('t'), while the y-axis represents an unspecified unit (likely distance or a relative scale). Three curves are plotted: mass (red dashed line), velocity (red dotted line), and altitude (blue solid line). The chart also includes two mathematical expressions related to the rocket's properties.
### Components/Axes
* **Title:** "Mass, velocity and altitude of the rocket" (top-center)
* **X-axis:** Labeled "t" (bottom-center), representing time. No specific units are indicated.
* **Y-axis:** Unlabeled, representing the magnitude of mass, velocity, and altitude. The scale ranges from approximately 0 to 1.
* **Legend:** Located in the top-right corner.
* Mass: Red dashed line (`--`)
* Velocity: Red dotted line (`:`)
* Altitude: Blue solid line (`-`)
* **Mathematical Expressions:**
* `<2m₀ 2m₀ / 3k²>` (top-center)
* `<m₀ m₀ / 2k>` (center-right)
### Detailed Analysis
* **Mass (Red Dashed Line):** The mass curve starts at approximately 0.7 on the y-axis at t=0. It decreases rapidly initially, then slows down, approaching 0 as time increases. The curve is concave down throughout its duration.
* **Velocity (Red Dotted Line):** The velocity curve starts at approximately 0 at t=0. It increases rapidly, reaches a maximum at approximately t=0.7, and then decreases, approaching 0 again as time increases. The curve is roughly symmetrical around its peak. A data point is marked at approximately (0.4, 0.4).
* **Altitude (Blue Solid Line):** The altitude curve starts at 0 at t=0. It increases rapidly, reaches a maximum at approximately t=1.2, and then decreases, returning to 0 as time increases. The curve is roughly symmetrical around its peak. A data point is marked at approximately (0.8, 0.9).
### Key Observations
* The mass of the rocket decreases over time, as expected due to fuel consumption.
* The velocity increases initially, reaches a maximum, and then decreases, indicating the rocket's ascent and subsequent descent.
* The altitude follows a similar pattern to velocity, increasing to a maximum height and then decreasing.
* The peak altitude corresponds to the point where the velocity begins to decrease.
* The mathematical expressions likely represent key parameters or calculations related to the rocket's motion, but their exact meaning is not clear without further context.
### Interpretation
The chart depicts the typical trajectory of a rocket. The decreasing mass indicates fuel burn, which drives the increase in velocity. As the fuel is exhausted, the rocket reaches its maximum altitude and begins to fall back to Earth due to gravity. The symmetry of the velocity and altitude curves suggests a simplified model without significant atmospheric drag or other external forces. The mathematical expressions likely relate to the rocket equation, describing the relationship between mass, velocity, and fuel consumption. The expressions `<2m₀ 2m₀ / 3k²>` and `<m₀ m₀ / 2k>` could represent the maximum velocity and altitude achieved, respectively, where m₀ is the initial mass and k is a constant related to the rocket's engine. The chart provides a visual representation of the fundamental principles governing rocket flight.