## Line Graph: Mass, Velocity, and Altitude of the Rocket
### Overview
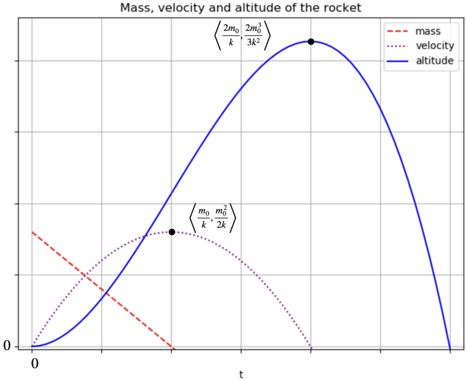
The graph depicts the dynamic behavior of a rocket's mass, velocity, and altitude over time. Three distinct lines represent these variables:
- **Mass** (red dashed line) decreases linearly.
- **Velocity** (purple dotted line) rises to a peak then declines.
- **Altitude** (blue solid line) follows a parabolic trajectory, peaking before descending.
### Components/Axes
- **X-axis**: Time (`t`), labeled with increments (0, 1, 2, 3, 4, 5).
- **Y-axis**: No explicit label, but values correspond to mass, velocity, and altitude.
- **Legend**: Located in the top-right corner, with color-coded labels:
- Red dashed: Mass
- Purple dotted: Velocity
- Blue solid: Altitude
### Detailed Analysis
1. **Mass (Red Dashed Line)**:
- Starts at `2m₀` (initial mass) and decreases linearly to `0` at `t = 2m₀/k`.
- Equation: `mass = 2m₀ - (m₀/k)t`.
2. **Velocity (Purple Dotted Line)**:
- Begins at `0` and increases to a peak at `t = m₀/k`, where velocity reaches `m₀²/(2k)`.
- Declines afterward, reaching `0` at `t = 2m₀/k`.
- Equation: `velocity = (m₀/k)t - (m₀²/(2k²))t²`.
3. **Altitude (Blue Solid Line)**:
- Starts at `0` and rises to a maximum at `t = 2m₀/k`, where altitude is `2m₀³/(3k²)`.
- Falls back to `0` at `t = 4m₀/k`.
- Equation: `altitude = (m₀²/(2k²))t² - (m₀³/(3k³))t³`.
### Key Observations
- **Mass-Altitude Relationship**: Mass decreases linearly while altitude follows a cubic trajectory, suggesting mass loss directly impacts propulsion efficiency.
- **Velocity Peak**: Velocity peaks at half the time of mass depletion (`t = m₀/k`), indicating optimal thrust-to-gravity ratio at this point.
- **Altitude Peak**: Altitude peaks at `t = 2m₀/k`, twice the time of velocity peak, reflecting the delay between maximum speed and maximum height due to deceleration.
### Interpretation
The graph models a rocket's ascent and descent under idealized conditions:
- **Mass Depletion**: Linear mass loss implies constant fuel burn rate, critical for calculating burn time (`2m₀/k`).
- **Velocity Dynamics**: The parabolic velocity curve highlights the balance between thrust acceleration and gravitational deceleration. The peak velocity (`m₀²/(2k)`) occurs when thrust force equals gravitational force.
- **Altitude Trajectory**: The cubic altitude curve demonstrates how velocity integration over time determines height. The peak altitude (`2m₀³/(3k²)`) occurs when velocity begins to decline significantly.
**Notable Anomalies**:
- The velocity and altitude peaks are temporally offset, emphasizing the delay between achieving maximum speed and maximum height.
- The mass line intersects the velocity peak at `t = m₀/k`, suggesting a critical point where mass reduction directly influences thrust efficiency.
This analysis assumes idealized physics (no air resistance, constant gravity) and highlights the interplay between mass, velocity, and altitude in rocket dynamics.