\n
## Chart: Importance Score vs. Reasoning Step
### Overview
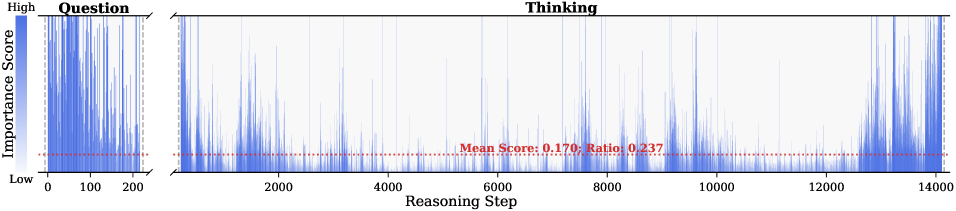
The image presents a chart visualizing the "Importance Score" over "Reasoning Step". The chart appears to represent the importance of each reasoning step during a question-answering or problem-solving process, divided into "Question" and "Thinking" phases. The chart is a line-like representation with significant fluctuations in importance score.
### Components/Axes
* **X-axis:** "Reasoning Step", ranging from 0 to approximately 14000.
* **Y-axis:** "Importance Score", ranging from "Low" to "High".
* **Chart Title/Sections:** The chart is divided into two sections labeled "Question" (from 0 to approximately 200 Reasoning Steps) and "Thinking" (from approximately 200 to 14000 Reasoning Steps).
* **Horizontal Line:** A dotted red horizontal line is present, labeled "Mean Score: 0.170, Ratio: 0.237".
* **Color Scheme:** The chart uses a blue color gradient to represent the importance score.
### Detailed Analysis
The chart displays a fluctuating importance score over the reasoning steps.
* **Question Phase (0-200 Reasoning Steps):** The importance score starts at a low value and rapidly increases to a high value within the first 200 reasoning steps. The score fluctuates significantly within this range.
* **Thinking Phase (200-14000 Reasoning Steps):** The importance score generally remains low, with frequent and substantial fluctuations. The score oscillates between low and moderate values, with occasional spikes reaching higher levels.
* **Mean Score:** The average importance score across all reasoning steps is 0.170.
* **Ratio:** The ratio associated with the mean score is 0.237.
### Key Observations
* The "Question" phase exhibits a much higher initial importance score compared to the "Thinking" phase.
* The "Thinking" phase is characterized by a consistently lower, but highly variable, importance score.
* The fluctuations in the "Thinking" phase suggest that the relevance of individual reasoning steps varies considerably.
* The mean score of 0.170 indicates that, on average, the importance score is relatively low throughout the entire reasoning process.
### Interpretation
The chart suggests that the initial steps involved in understanding a question ("Question" phase) are significantly more important than the subsequent reasoning steps ("Thinking" phase). However, the high variability in the "Thinking" phase indicates that some reasoning steps are crucial, while others are less relevant. The low mean score suggests that the overall reasoning process is not consistently focused on highly important steps.
The ratio of 0.237 could represent the proportion of reasoning steps that exceed the mean importance score. This implies that approximately 23.7% of the reasoning steps are considered more important than the average.
This data could be used to optimize reasoning algorithms or to identify areas where the reasoning process can be improved. For example, focusing on the initial question understanding phase or identifying and prioritizing the most important reasoning steps could lead to more efficient and accurate problem-solving. The chart highlights the dynamic nature of the reasoning process and the importance of considering the context of each reasoning step.