## Line Chart: Importance Scores Across Reasoning Steps
### Overview
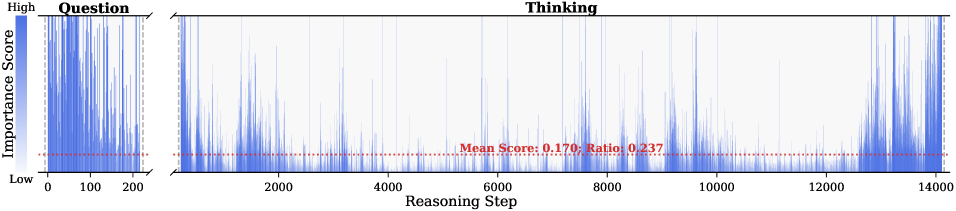
The image is a line chart divided into two sections: "Question" (left) and "Thinking" (right). It visualizes the distribution of "Importance Scores" across "Reasoning Steps" (x-axis) and "Importance Score" (y-axis). A red dashed line labeled with a "Mean Score" and "Ratio" is overlaid on the "Thinking" section.
### Components/Axes
- **Y-Axis (Left)**: "Importance Score" with a gradient from "Low" (light blue) to "High" (dark blue).
- **X-Axis (Right)**: "Reasoning Step" ranging from 0 to 14,000.
- **Legend**: A vertical color bar on the left, labeled "Importance Score" with a gradient from light blue (low) to dark blue (high).
- **Red Dashed Line**: Horizontal line in the "Thinking" section, labeled "Mean Score: 0.170; Ratio: 0.237".
### Detailed Analysis
- **Question Section (Left)**:
- A vertical line with dense, high-intensity spikes (dark blue) concentrated near the top of the y-axis.
- No numerical values or labels for individual data points.
- The x-axis for this section is not explicitly labeled but appears to span 0–200 reasoning steps.
- **Thinking Section (Right)**:
- A horizontal line with sparse, irregular spikes (dark blue) distributed across the x-axis (0–14,000).
- The red dashed line spans the entire "Thinking" section, indicating a mean importance score of **0.170** and a ratio of **0.237**.
- The ratio likely compares the "Thinking" section's importance to the "Question" section.
### Key Observations
1. **High Importance in "Question"**: The "Question" section shows a concentrated cluster of high importance scores, suggesting critical focus on the initial question phase.
2. **Variable Importance in "Thinking"**: The "Thinking" section has scattered, low-intensity spikes, indicating inconsistent importance across reasoning steps.
3. **Mean and Ratio**: The mean score of 0.170 (low) and ratio of 0.237 suggest the "Thinking" section's importance is significantly lower than the "Question" section.
### Interpretation
The chart implies that the model prioritizes the "Question" phase over the "Thinking" phase. The high concentration of importance scores in the "Question" section suggests that the initial query is the primary driver of the model's output. In contrast, the "Thinking" phase exhibits lower and more variable importance, possibly indicating that reasoning steps are less critical or that their impact is diluted. The red dashed line quantifies this disparity, highlighting that the "Thinking" section's average importance is only 23.7% of the "Question" section's baseline. This could reflect a design choice where the model emphasizes direct question interpretation over iterative reasoning.