\n
## Diagram: Causal Inference & Model Reasoning
### Overview
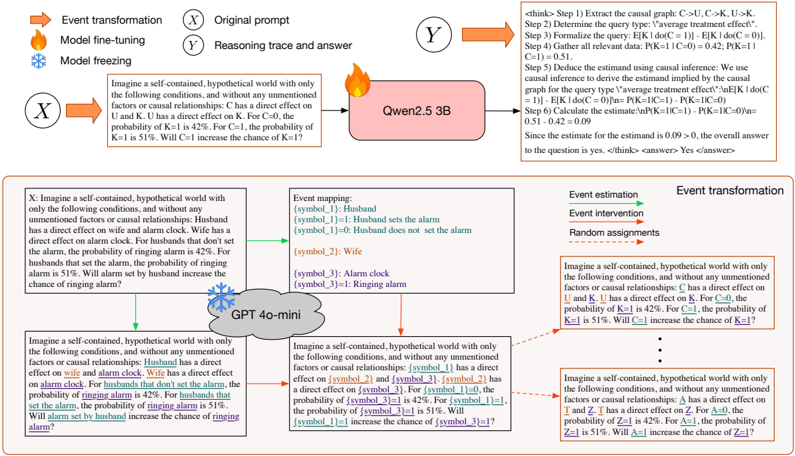
This diagram illustrates a causal inference process, likely within a machine learning or AI context. It depicts a scenario involving a husband, wife, and alarm clock, used to demonstrate reasoning trace and answer generation. The diagram combines a causal graph, text descriptions of a hypothetical world, event mapping, and a reasoning flow. It appears to be exploring the impact of interventions (setting/not setting an alarm) on probabilities.
### Components/Axes
The diagram is segmented into several key areas:
* **Top-Left (Event Transformation):** Contains three icons representing "Event transformation", "Model fine-tuning", and "Model freezing", colored blue, light blue, and dark blue respectively.
* **Top-Center (Original Prompt & Reasoning Trace and Answer):** Contains text blocks describing the original prompt and the resulting reasoning trace and answer.
* **Top-Right (think> Steps):** A numbered list outlining the steps in a causal inference process.
* **Center (Causal Graph):** A directed acyclic graph with nodes labeled 'X', 'Y', 'K', 'C', and 'U'. Edges indicate causal relationships. Node 'Y' has a value of "Qwen2.5 3B" associated with it.
* **Bottom-Left (Event Mapping):** A section detailing the mapping of symbols to real-world entities: Husband, Wife, Alarm Clock, Ringing Alarm.
* **Bottom-Center (GPT 40-mini):** A visual representation of a GPT model, with arrows indicating input and output.
* **Bottom-Right (Event Estimation, Event Intervention, Random Assignments):** Text blocks describing a hypothetical world and the impact of interventions.
### Detailed Analysis or Content Details
**1. Causal Graph:**
* Nodes: X, Y, K, C, U.
* Edges: X -> Y, U -> K, K -> C, C -> U.
* Node Y: Labeled "Qwen2.5 3B".
* The graph represents a causal model where X influences Y, U influences K, K influences C, and C influences U.
**2. Top-Right (think> Steps):**
* Step 1: Extract the causal graph: C -> U, C -> K.
* Step 2: Determine the query type: "Average treatment effect".
* Step 3: Formalize the query: E[K | do(C = 1)] - E[K | do(C = 0)].
* Step 4: Gather all relevant data: P(K = 1 | C = 0) = 0.42; P(K = 1 | C = 1) = 0.51.
* Step 5: Deduce the estimand using causal inference: E[K | do(C = 1)] - E[K | do(C = 0)] = 0.51 - 0.42 = 0.09.
* Final Statement: Since the estimate is 0.09 > 0, the overall answer to the question is: yes.
**3. Hypothetical World (Text Blocks):**
* **First Instance:** "Imagine a self-contained, hypothetical world with only the following conditions, and without any unmentioned factors or causal relationships: C has a direct effect on U and K. U has a direct effect on K. For C=0, the probability of K=1 is 42%. For C=1, the probability of K=1 is 51%. Will C=1 increase the probability of K=1?"
* **Second Instance:** "Imagine a self-contained, hypothetical world with only the following conditions, and without any unmentioned factors or causal relationships: Husband has a direct effect on wife and alarm clock. Wife has a direct effect on alarm clock. For husbands that don't set the alarm, the probability of ringing alarm is 42%. For husbands that set the alarm, the probability of ringing alarm is 51%. Will alarm set by husband increase the chance of ringing alarm?"
**4. Event Mapping:**
* [symbol\_1]: Husband
* [symbol\_2]: Wife
* [symbol\_3]: Alarm clock
* [symbol\_4]: Ringing alarm
**5. GPT 40-mini:**
* Input: "Husband has a direct effect on wife and alarm clock. Wife has a direct effect on alarm clock. For husbands that don't set the alarm, the probability of ringing alarm is 42%. For husbands that set the alarm, the probability of ringing alarm is 51%. Will alarm set by husband increase the chance of ringing alarm?"
* Output: "Husband has a direct effect on wife and alarm clock. Wife has a direct effect on alarm clock. For husbands that don't set the alarm, the probability of ringing alarm is 42%. For husbands that set the alarm, the probability of ringing alarm is 51%. Will alarm set by husband increase the chance of ringing alarm?"
### Key Observations
* The diagram demonstrates a causal inference process applied to a simple scenario.
* The "Qwen2.5 3B" label suggests the use of a language model (likely a large language model) in the reasoning process.
* The steps outlined in the top-right corner clearly define the methodology for calculating the average treatment effect.
* The probability values (42% and 51%) are central to the causal inference calculation.
* The GPT 40-mini section shows the model receiving and echoing the input prompt, suggesting it's involved in processing the scenario.
* The diagram uses a consistent symbolic representation for entities (husband, wife, etc.).
### Interpretation
The diagram illustrates how a causal model can be used to reason about the effects of interventions. The scenario involving the husband, wife, and alarm clock serves as a concrete example to demonstrate the application of causal inference techniques. The steps outlined in the top-right corner show how to formalize a query, gather relevant data, and calculate the average treatment effect. The involvement of the "Qwen2.5 3B" model suggests that language models can be used to represent and reason about causal relationships. The diagram highlights the importance of identifying causal relationships and quantifying their effects in order to make informed decisions. The consistent positive result (0.09 > 0) indicates that the intervention (setting the alarm) does indeed increase the probability of the desired outcome (ringing alarm). The diagram is a visual representation of a complex process, breaking it down into manageable steps for clarity. The repetition of the prompt in the GPT 40-mini section might indicate a preliminary stage of processing or a simple echo mechanism.