TECHNICAL ASSET FINGERPRINT
dad95f97fabc5c4ba293d7af
Click to view fullscreen
Press ESC or click to close
FOUND IN PAPERS
EXPERT: healer-alpha-free VERSION 1
RUNTIME: free/openrouter/healer-alpha
INTEL_VERIFIED
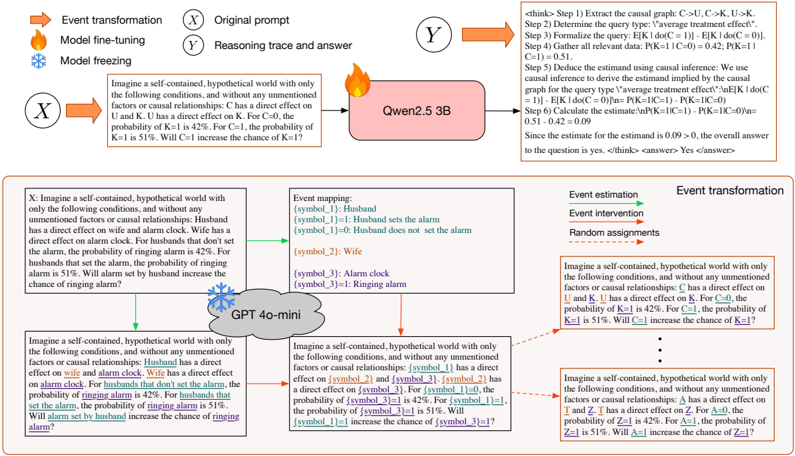
## Diagram: Causal Reasoning Process with Language Models
### Overview
This image is a technical diagram illustrating a multi-step process for causal reasoning and prompt transformation using large language models (LLMs). It demonstrates how a natural language prompt describing a causal scenario is processed by a model (Qwen2.5 3B) to produce a reasoning trace and answer, and how the same core prompt can be systematically transformed into different symbolic and hypothetical variants for tasks like event estimation and intervention. The diagram is divided into three main sections: a top flowchart of the core reasoning process, a middle section showing event mapping, and a bottom section showing prompt transformation variants.
### Components/Axes
The diagram is organized into distinct regions with labeled components and flow arrows.
**1. Top Flowchart (Core Reasoning Process):**
* **Input (X):** A box labeled "X" containing the "Original prompt". The text is: "Imagine a self-contained, hypothetical world with only the following conditions, and without any unmentioned factors or causal relationships: Husband has a direct effect on alarm clock. Wife has a direct effect on alarm clock. For husbands that set the alarm, the probability of ringing alarm is 42%. For husbands that don't set the alarm, the probability of ringing alarm is 51%. Will setting the alarm increase the chance of ringing alarm?"
* **Process Arrow:** An orange arrow labeled "Event transformation" points from X to a model icon.
* **Model Icon:** A pink rounded rectangle labeled "Qwen2.5 3B" with a flame icon (indicating "Model fine-tuning" per the legend).
* **Output (Y):** An orange arrow points to a box labeled "Y" containing the "Reasoning trace and answer". The text is a multi-step reasoning trace:
* ` <answer> No </answer>`
**2. Legend (Top Left):**
* Orange arrow icon: "Event transformation"
* Flame icon: "Model fine-tuning"
* Snowflake icon: "Model freezing"
* Circle with X: "Original prompt"
* Circle with Y: "Reasoning trace and answer"
**3. Middle Section (Event Mapping):**
* A large box on the left contains the same original prompt as in component 1, but with key phrases highlighted in different colors (e.g., "Husband" in blue, "alarm clock" in orange, "ringing alarm" in red).
* A green arrow labeled "Event mapping" points to a table titled "Event mapping:".
* **Event Mapping Table:**
| Symbol/Condition | Meaning |
|------------------|---------|
| [symbol_1] | Husband |
| [symbol_1]=1 | Husband sets the alarm |
| [symbol_1]=0 | Husband does not set the alarm |
| [symbol_2] | Wife |
| [symbol_3] | Alarm clock |
| [symbol_3]=1 | Ringing alarm |
**4. Bottom Section (Prompt Transformation & Model Application):**
* A central cloud icon labeled "GPT 4o-mini" with a snowflake icon (indicating "Model freezing").
* **Left Branch (Event Estimation):** A green arrow from the original prompt box points to a transformed prompt. The text is the same as the original, but with natural language terms replaced by symbolic placeholders: "Husband" -> `[symbol_1]`, "set the alarm" -> `[symbol_1]=1`, "don't set the alarm" -> `[symbol_1]=0`, "ringing alarm" -> `[symbol_3]=1`.
* **Right Branch (Event Intervention & Random Assignment):** A red arrow from the original prompt box points to a series of transformed prompts.
* The first prompt is for "Event intervention": "Imagine a self-contained, hypothetical world with only the following conditions, and without any unmentioned factors or causal relationships: C has a direct effect on U and K. U has a direct effect on K. For C=1, the probability of K=1 is 42%. For C=0, the probability of K=1 is 51%. Will C=1 increase the chance of K=1?" (Here, "Husband" is replaced with "C", "set the alarm" with "C=1", etc.).
* Below this, separated by ellipses (...), is a prompt for "Random assignment": "Imagine a self-contained, hypothetical world with only the following conditions, and without any unmentioned factors or causal relationships: T has a direct effect on Z and D. Z has a direct effect on D. For T=1, the probability of D=1 is 42%. For T=0, the probability of D=1 is 51%. Will T=1 increase the chance of D=1?" (Here, variables are replaced with T, Z, D).
* **Labels:** The right side has vertical labels: "Event estimation", "Event intervention", "Random assignment", with a red arrow pointing from "Event transformation" to the intervention/assignment prompts.
### Detailed Analysis
The diagram meticulously details a pipeline for causal reasoning:
1. **Core Task:** An LLM (Qwen2.5 3B) is given a natural language description of a causal world with conditional probabilities. It performs a 6-step reasoning process to compute an "average treatment effect" and answers a causal question ("Will X increase the chance of Y?").
2. **Symbolic Generalization:** The process shows how the specific entities in the prompt ("Husband", "Wife", "alarm clock") can be mapped to abstract symbols (`[symbol_1]`, `[symbol_2]`, `[symbol_3]`). This allows the creation of a generalized prompt template.
3. **Transformation for Different Causal Tasks:** Using the symbolic mapping, the original prompt is transformed into variants suitable for different causal inference frameworks:
* **Event Estimation:** Uses the symbolic placeholders.
* **Event Intervention:** Uses standard causal notation (C, U, K) and interventional probabilities (P(K=1|do(C=1))).
* **Random Assignment:** Uses different variable names (T, Z, D) to represent a scenario of random assignment, distinct from the observational "Husband sets alarm" scenario.
4. **Model Roles:** The diagram specifies which models are fine-tuned (flame icon: Qwen2.5 3B for the core reasoning) and which are frozen (snowflake icon: GPT 4o-mini, likely used for the transformation/mapping step).
### Key Observations
* **Precise Numerical Data:** The causal scenario uses specific probabilities: 42% (0.42) for the "treatment" group (Husband sets alarm) and 51% (0.51) for the "control" group (Husband does not set alarm).
* **Causal Graph Extraction:** The model's reasoning trace explicitly extracts a causal graph: `C->U, C->K, U->K`. This implies three variables: C (Cause/Husband), U (Unmentioned factor/Wife?), K (Effect/Ringing alarm). The graph shows C directly affects both U and K, and U affects K.
* **Correct Causal Calculation:** The model correctly identifies that for the "average treatment effect" query, the estimate is `P(K=1|C=1) - P(K=1|C=0) = 0.42 - 0.51 = -0.09`. Since this is negative, it correctly answers "No" to the question of whether setting the alarm increases the chance.
* **Systematic Abstraction:** The transformation from natural language to symbols to standard causal notation is systematic, preserving the numerical values and logical structure while changing the representational format.
### Interpretation
This diagram serves as a technical blueprint for evaluating and enhancing the causal reasoning capabilities of LLMs. It demonstrates a method to:
1. **Test Causal Understanding:** By providing a model with a textual causal scenario and checking if it can correctly compute interventional quantities (like ATE) using the right causal calculus (here, recognizing that with the given graph, `E[K|do(C=c)] = P(K=1|C=c)`).
2. **Create Generalized Benchmarks:** The event mapping and transformation process shows how a single underlying causal structure can be instantiated in multiple linguistic and symbolic forms. This is crucial for creating robust benchmarks that test whether a model understands the abstract causal logic, rather than memorizing patterns from specific phrasings.
3. **Probe Model Robustness:** By comparing the outputs of a fine-tuned model (Qwen2.5 3B) on the original prompt versus the transformed prompts (potentially processed by a different frozen model like GPT 4o-mini), researchers can investigate how model architecture, training, and prompt format affect causal reasoning performance.
The core insight is that reliable causal reasoning in AI requires moving beyond pattern matching in text to an internal representation of causal structures and the ability to apply interventional logic consistently across different representational formats. The diagram outlines a concrete pipeline for developing and testing this capability.
DECODING INTELLIGENCE...